Buckles plot
Revision as of 18:19, 26 March 2015 by Cwhitehurst (talk | contribs)
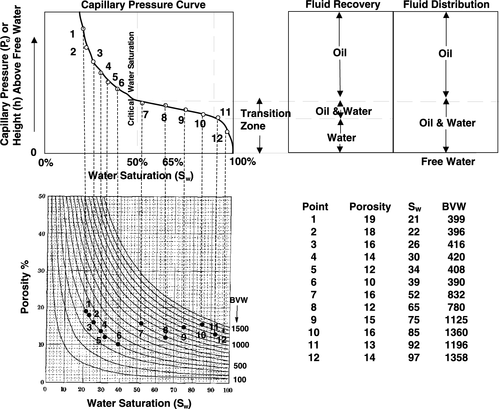
A Buckles plot is a plot of water saturation (Sw) vs. porosity. Contours of equal bulk volume water (BVW) are drawn on the plot.
- Points plot on a hyperbolic BVW line where the formation is near immobile water if the points come from a reservoir with consistent pore type and pore geometry.
- Points scatter on a Buckles plot where the formation falls below the top of the transition zone.
Figure 1 shows how a Buckles plot relates to capillary pressure, fluid distribution, and fluid recovery in a reservoir.[1]
References
- ↑ Hartmann, D. J., and E. A. Beaumont, Predicting Reservoir System Quality and Performance, in E. A. Beaumont and N. H. Foster, Exploring for Oil and Gas Traps, AAPG Treatise of Petroleum Geology Handbook of Petroleum Geology 3, p. 9-1--9-154
