Difference between revisions of "Example: mapping depocenters through time"
Cwhitehurst (talk | contribs) |
Cwhitehurst (talk | contribs) |
||
| Line 20: | Line 20: | ||
file:sedimentary-basin-analysis_fig4-4.png|{{figure number|1}}Major sand influxes into the northern Gulf of Mexico from Late Cretaceous to recently. After Winker;<ref name=Winker1982>Winker, C. D., Cenozoic shelf margins, northwestern Gulf of Mexico: Gulf Coast Assoc. of Geological Societies Transactions, vol. 32, p. 427-448.</ref> courtesy Gulf Coast Association of Geological Societies. | file:sedimentary-basin-analysis_fig4-4.png|{{figure number|1}}Major sand influxes into the northern Gulf of Mexico from Late Cretaceous to recently. After Winker;<ref name=Winker1982>Winker, C. D., Cenozoic shelf margins, northwestern Gulf of Mexico: Gulf Coast Assoc. of Geological Societies Transactions, vol. 32, p. 427-448.</ref> courtesy Gulf Coast Association of Geological Societies. | ||
file:sedimentary-basin-analysis_fig4-6.png|{{figure number|2}}Tectonic map of the GOM basin. Modified from Buffler;<ref name=Buffler1991>Buffler, R. T., 1991, Early evolution of the Gulf of Mexico basin, in D. Goldthwaite, ed., An introduction to central Gulf Coast geology: New Orleans Gulf Coast Geological Society, p. 1-16.</ref> courtesy New Orleans Geological Society. | file:sedimentary-basin-analysis_fig4-6.png|{{figure number|2}}Tectonic map of the GOM basin. Modified from Buffler;<ref name=Buffler1991>Buffler, R. T., 1991, Early evolution of the Gulf of Mexico basin, in D. Goldthwaite, ed., An introduction to central Gulf Coast geology: New Orleans Gulf Coast Geological Society, p. 1-16.</ref> courtesy New Orleans Geological Society. | ||
| − | file:sedimentary-basin-analysis_fig4-8.png|{{figure number|3}}Traditional regional cross section showing highly deformed salt rooted within the in-place Middle Jurassic mother salt. Modified after Antoine et al. | + | file:sedimentary-basin-analysis_fig4-8.png|{{figure number|3}}Traditional regional cross section showing highly deformed salt rooted within the in-place Middle Jurassic mother salt. Modified after Antoine et al.;<ref name=Antoine1974>Antoine, J. W., R. G. Ray, Jr., T. G. Pyle, and W. R. Bryant, 1974, Continental margins of the Gulf of Mexico, in C. A. Burk and C. L. Drake, eds., The geology of margins: New York, Springer-Verlag, p. 683-693</ref> courtesy Springer Verlag. |
file:sedimentary-basin-analysis_fig4-9.png|{{figure number|4}}More recent model of salt deformation recognizing both the in-place Middle Jurassic mother salt and displaced sheets of Middle Jurassic salt that have become detached from the mother salt. From Hall et al (1993);{{citation needed}}; courtesy Gulf Coast SEPM. | file:sedimentary-basin-analysis_fig4-9.png|{{figure number|4}}More recent model of salt deformation recognizing both the in-place Middle Jurassic mother salt and displaced sheets of Middle Jurassic salt that have become detached from the mother salt. From Hall et al (1993);{{citation needed}}; courtesy Gulf Coast SEPM. | ||
</gallery> | </gallery> | ||
Revision as of 14:13, 31 March 2014
| Exploring for Oil and Gas Traps | |

| |
| Series | Treatise in Petroleum Geology |
|---|---|
| Part | Critical elements of the petroleum system |
| Chapter | Sedimentary basin analysis |
| Author | John M. Armentrout |
| Link | Web page |
| Store | AAPG Store |
Mapping age-specific isopach thicks in the northern GOM basin defines laterally shifting sites of maximum deposition (Figure 1). Methods of mapping are clearly presented in Tearpock and Bischke.[1]
GOM basin depocenter time intervals
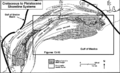
Figure 1 Major sand influxes into the northern Gulf of Mexico from Late Cretaceous to recently. After Winker;[2] courtesy Gulf Coast Association of Geological Societies.
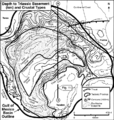
Figure 2 Tectonic map of the GOM basin. Modified from Buffler;[3] courtesy New Orleans Geological Society.
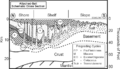
Figure 3 Traditional regional cross section showing highly deformed salt rooted within the in-place Middle Jurassic mother salt. Modified after Antoine et al.;[4] courtesy Springer Verlag.
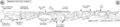
Figure 4 More recent model of salt deformation recognizing both the in-place Middle Jurassic mother salt and displaced sheets of Middle Jurassic salt that have become detached from the mother salt. From Hall et al (1993);[citation needed]; courtesy Gulf Coast SEPM.


In the northern GOM basin, depocenters prograde (Figure 1) over the transitional crust (Figure 2) and deform the underlying salt into a complex network of salt-cored anticlines and salt-withdrawal synclines (Figures 3 and 4). Late Neogene depocenters of the Mississippi River, the largest source of sediment to the northern Gulf of Mexico, developed during five time periods from the latest Miocene through Holocene (from Piggott;[5] see also Goldthwaite.[6] Following are the five depocenter intervals and their time periods.
| Interval | Time period, ma |
|---|---|
| A | 6–4 |
| B | 4–3 |
| C | 3–2.5 |
| D | 2.5–1 |
| E | 1–Present |
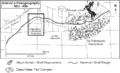
Figure 5 Paleogeography of the Mississippi River depositional system from approximately 6 Ma to 4 Ma (interval A). After Piggott and Pulham[5]). Copyright: Gulf Coast Section SEPM.
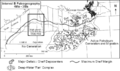
Figure 6 Paleogeography from approximately 4 Ma to 3 Ma (interval B). After Piggott and Pulham[5]). Copyright: Gulf Coast Section SEPM.
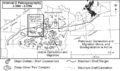
Figure 7 Paleogeography from approximately 2.5 Ma to 2vMa (interval D). After Piggott and Pulham[5]). Copyright: Gulf Coast Section SEPM.
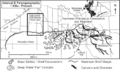
Figure 8 Paleogeography from approximately 1 Ma to the present (interval E). After Piggott and Pulham[5]). Courtesy Gulf Coast Section SEPM. Also after Weimer (1990)[citation needed]; courtesy AAPG.


Figures 5, 6, 7, and 8 are maps of depocenters and paleogeography for intervals A, B, D, and E. These were constructed by correlating wells using fossil extinction events and grids of interpreted seismic reflection profiles. The High Island–East Breaks study area is shown on each map.
Formation of high island-east breaks depocenter
Between 2.5 and 2.0 Ma, the major northern GOM basin depocenter was focused offshore of western Louisiana and eastern Texas. The westernmost part of this depocenter appears to have been the input area for the ancestral Mississippi River system. The resulting depocenter, the High Island–East Breaks depocenter, has more than depth::16,000 ft (4875 m) of late Pliocene and early Pleistocene sediments deposited during a succession of highamplitude sea level cycles.
Timing of petroleum generation
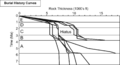
Figure 9 After Piggott and Pulham[5] Copyright: Gulf Coast SEPM.
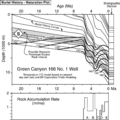
Figure 10 After Piggott and Pulham[5]). Copyright: Gulf Coast SEPM.


Each of the isopach maps in this section is annotated with the area of active petroleum generation and migration. These comments are based on the modeling of Piggott and Pulham[5]), illustrated and discussed along with Figures 9 and 10.
Interval A paleogeography
Figure 5 shows the paleogeography of the Mississippi River depositional system from approximately 6 Ma to 4 Ma (interval A). Deposition consists of net sand isopach thicks on the shelf and intraslope basins that are interpreted to be deepwater “fan” complexes.
Interval B paleogeography
Figure 6 paleogeography from approximately 4 Ma to 3 Ma (interval B). Shelf and intraslope basin thicks are potentially sand prone. (Note the shift westward from the previous depocenter location.)
Interval D paleogeography
Figure 7 shows paleogeography from approximately 2.5 Ma to 2 Ma (interval D). Again, shelfal net sand thicks and intraslope basin isopach thicks interpreted to be deepwater “Tan” complexes are the dominant depositional environments. Note the depocenter has shifted to offshore western Louisiana and Texas. The High Island-East Breaks study area occurs within the western part of this depocenter.
Interval E paleogeography
The paleogeographic map in Figure 8 represents time from about 1 Ma to the present (interval E). Canyons are interpreted from incised and back-filled geometries on seismic reflection profiles. Note the depocenter has shifted back to offshore eastern Louisiana from the preceding location offshore eastern Texas/western Louisiana.
Depocenter summary


Mapping age-specific isopach thicks defines laterally shifting sites of maximum deposition along the margin of the basin. Each of these depocenters has a unique history of accumulation with consequent variations in maturation, migration, and entrapment histories. Evaluation of depocenter maps should include comparison of the results with the largerscale isopach maps (Figures 11, 12).
GOM depocenter summary
In the case of the northern Gulf of Mexico, the depocenters prograde over the transitional crust and deform the underlying salt, forming a complex network of salt-cored anticlines and salt-withdrawal synclines. Between 2.5 and 2.0 Ma, the major northern Gulf of Mexico depocenter was focused offshore western Louisiana and eastern Texas. The westernmost part of this depocenter area, the High Island–East Breaks depocenter, appears to have been the input area for the ancestral Mississippi River system. The resulting depocenter has more than depth::16,000 ft (4875 m) of late Pliocene and early Pleistocene sediments deposited during a succession of high-amplitude sea level cycles (see section C, Depositional Sequences).
See also
References
- ↑ Tearpock, D., J., Bischke, R., E., 1991, Applied Subsurface Geologic Mapping: Prentice-Hall, 648 p.
- ↑ Winker, C. D., Cenozoic shelf margins, northwestern Gulf of Mexico: Gulf Coast Assoc. of Geological Societies Transactions, vol. 32, p. 427-448.
- ↑ Buffler, R. T., 1991, Early evolution of the Gulf of Mexico basin, in D. Goldthwaite, ed., An introduction to central Gulf Coast geology: New Orleans Gulf Coast Geological Society, p. 1-16.
- ↑ Antoine, J. W., R. G. Ray, Jr., T. G. Pyle, and W. R. Bryant, 1974, Continental margins of the Gulf of Mexico, in C. A. Burk and C. L. Drake, eds., The geology of margins: New York, Springer-Verlag, p. 683-693
- ↑ 5.0 5.1 5.2 5.3 5.4 5.5 5.6 5.7 Piggott, N., Pulham, A., 1993, Sedimentation rate as the control on hydrocarbon sourcing, generation, and migration in the deepwater Gulf of Mexico: Proceedings, Gulf Coast Section SEPM 14th Annual Research conference, p. 179–191.
- ↑ Goldthwaite, D., 1991, Central Gulf Coast stratigraphy, in Goldthwaite, D., ed., An Introduction to Central Gulf Coast Geology: New Orleans Geological Society, p. 17–30.
- ↑ Winker, C., D., 1982, Cenozoic shelf margins, northwestern Gulf of mexico: Gulf Coast Assoc. of Geological Societies Transactions, vol. 32, p. 427–448.
External links
| find literature about Example: mapping depocenters through time |