File:Overview-of-routine-core-analysis fig1.png
Revision as of 22:39, 13 January 2014 by Importer (talk | contribs) (Comparison of water saturation data (Jenkins, 1987) from sidewall and conventional cores shows that sidewall core values are almost always higher than conventional core values. Sample values from gas condensate zones are 10 to 15% higher, while values ...)

Size of this preview: 564 × 599 pixels. Other resolutions: 226 × 240 pixels | 943 × 1,002 pixels.
Original file (943 × 1,002 pixels, file size: 17 KB, MIME type: image/png)
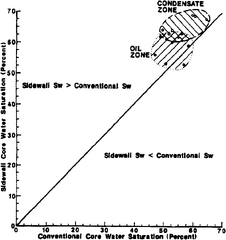
Comparison of water saturation data (Jenkins, 1987) from sidewall and conventional cores shows that sidewall core values are almost always higher than conventional core values. Sample values from gas condensate zones are 10 to 15% higher, while values from oil zones are 5 to 10% higher.
File history
Click on a date/time to view the file as it appeared at that time.
| Date/Time | Thumbnail | Dimensions | User | Comment | |
|---|---|---|---|---|---|
| current | 22:39, 13 January 2014 | | 943 × 1,002 (17 KB) | Importer (talk | contribs) | Comparison of water saturation data (Jenkins, 1987) from sidewall and conventional cores shows that sidewall core values are almost always higher than conventional core values. Sample values from gas condensate zones are 10 to 15% higher, while values ... |
You cannot overwrite this file.
File usage
The following page uses this file: