File:Subsurface-maps fig7.png
Jump to navigation
Jump to search
Size of this preview: 418 × 599 pixels. Other resolutions: 167 × 240 pixels | 944 × 1,353 pixels.
Original file (944 × 1,353 pixels, file size: 62 KB, MIME type: image/png)
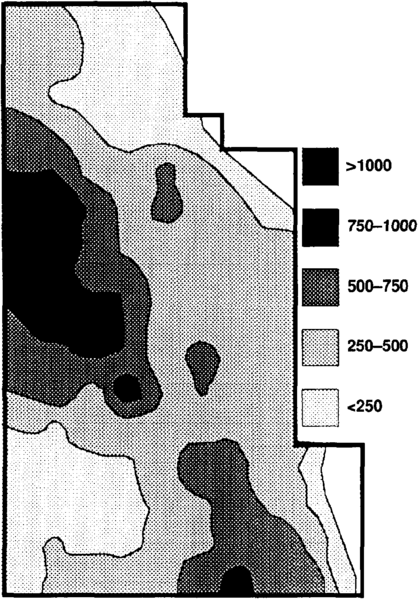
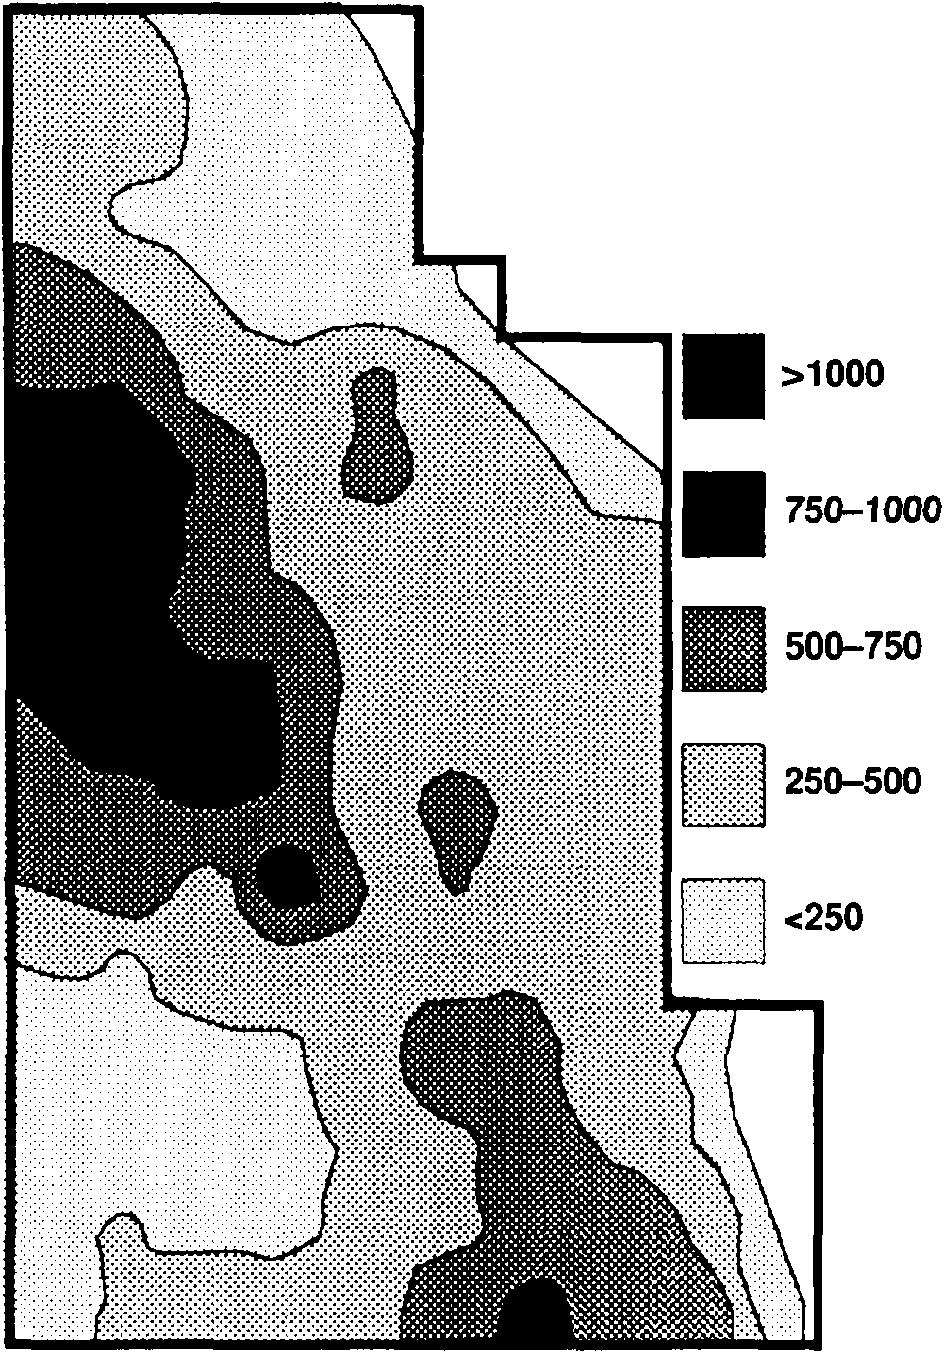
Cumulative oil production map for the A, B, C, and D zones from the San Andres Formation reservoir, Jordan field, Ector and Crane counties, Texas. Contours in MSTB/year/acre. (After Major and Holtz, 1989.)
File history
Click on a date/time to view the file as it appeared at that time.
| Date/Time | Thumbnail | Dimensions | User | Comment | |
|---|---|---|---|---|---|
| current | 20:42, 14 January 2014 | | 944 × 1,353 (62 KB) | Importer (talk | contribs) | Cumulative oil production map for the A, B, C, and D zones from the San Andres Formation reservoir, Jordan field, Ector and Crane counties, Texas. Contours in MSTB/year/acre. (After Major and Holtz, 1989.) Category:Geological methods |
You cannot overwrite this file.
File usage
The following page uses this file: