Identifying depositional sequences from biostratigraphic data
| Exploring for Oil and Gas Traps | |

| |
| Series | Treatise in Petroleum Geology |
|---|---|
| Part | Critical elements of the petroleum system |
| Chapter | Sedimentary basin analysis |
| Author | John M. Armentrout |
| Link | Web page |
| Store | AAPG Store |
Biostratigraphic data can aid in identifying individual depositional sequences and stacked depositional sequences, especially when integrated with lithofacies and seismic facies. Biostratigraphic data include the following:
- Microfossil abundance patterns
- Extinction events
- Biofacies
Microfossil abundance patterns
Microfossil abundance patterns derived from examining well cuttings may provide highresolution observations for identifying depositional sequences. Total microfossil abundance patterns reflect changes in sediment accumulation rates, provided the biogenic productivity varies less than the sediment accumulation rate. For example, during the reduced rate of sediment accumulation associated with transgression, the middle-shelf and deeper transgressive-phase deposits may be characterized by an increase in fossil abundance due to relative terrigenous sediment starvation and consequent concentration of fossil material. If the same conditions of biotic productivity hold during the increased rate of sediment accumulation associated with a prograding system, the accumulated sediments may be characterized by a decrease in fossil abundance due to dilution and environmental stress.[1][2]
Applying abundance patterns
In the Texas offshore Pliocene and Pleistocene depocenter, patterns of fossil abundance are often the most widely applicable observational criteria for identifying the surfaces that define sequences.[3][4][5] Sequence boundaries are associated with intervals of few or no in situ fossils and often abundance peaks of reworked fossils in the overlying lowstand systems tract. The transgressive surface is characterized by the stratigraphic upward change from decreasing fossil abundance to increasing abundance. The maximum flooding surface is marked by the maximum fossil abundance interval due to sediment starvation[6][2]

Example abundance pattern
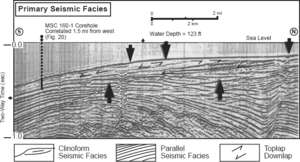
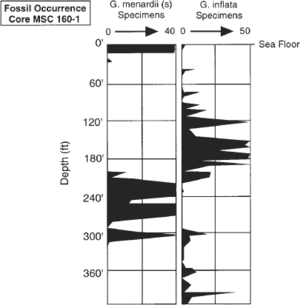
The figure below is an abundance histogram for the planktonic foraminiferal microfossils Globorotalia menardii (s = sinistral) and Globorotalia inflata from the MSC 160-1 core hole, East Breaks area (data provided by Gerry Ragan, Mobil Exploration and Producing US). The core hole is length::0.3 mi to the west of the seismic reflection profile shown in Figure 1. Data on sediment type and biostratigraphy from core hole MSC 160-1 permits geologic characterizations of both the regionally parallel and locally shingled-clinoform seismic facies.
The figure contrasts the abundance of sinistral (s) Globorotalia menardii (G. menardii) with that of Globorotalia inflata (G. inflata) in each sample. Note the alternating pattern of abundance.
Pattern interpretation

The high abundance of G. menardii at depths of 0-20 ft (0-7 m) shown in Figure 2 correlates with the interval at the sea floor that is part of the regionally extensive transgressive mud of the Holocene. The arrow on the seismic section, shown on Figure 4-19, at about 0.6 sec (two-way time) marks a trough between two high-amplitude continuous reflections that also correlate with the high-abundance interval of G. menardii between 190 and length::320 ft (58 and 98 m). In contrast, the stratigraphic intervals of G. menardii low abundance and G. inflata high abundance correlate with the shingled-clinoform seismic facies.
Stratigraphic intervals with abundant G. menardii are interpreted to indicate warmwater interglacial conditions, and abundant G. inflata are interpreted as temperate-water glacial indicators.[8][9] The correlation of abundant G. menardii with the regionally extensive transgressive mud of the Holocene provides local confirmation of the warm-water interglacial interpretation. The regionally continuous reflections at 0.6 sec also indicate a transgressive interglacial interval. The shingledclinoform facies correlates with the G. inflata abundance peak, suggesting deposition during temperate-water glacial conditions.
Note that the intervals of abundant G. menardii are thicker than intervals with abundant G. inflata. This suggests that more sediment accumulates associated with glacial low-stand progradation. Deposition of the thick clinoform packages necessitates some fault movement to accommodate the sediment accumulation.[7]
See also
- East Breaks depositional sequence
- Definitions of depositional system elements
- Identifying depositional sequences
- Identifying depositional sequences in seismic sections
- Recognizing stacked depositional sequences in seismic profiles
- Recognizing stacked depositional sequences from well data
- Biostratigraphy in sequence stratigraphy
References
- ↑ Shaffer, B. L., 1987, The potential of calcareous nannofossils for recognizing Plio–Pleistocene climatic cycles and sequence boundaries on the shelf: Proceedings, Gulf Coast Section SEPM 8th Annual Research conference, p. 142–145.
- ↑ 2.0 2.1 Armentrout, J. M.,and J. F. Clement, 1990, Biostratigraphic calibration of depositional cycles: a case study in High Island–Galveston–East Breaks areas, offshore Texas: Proceedings, Gulf Coast Section SEPM 11th Annual Research Conference, p. 21–51.
- ↑ Armentrout, J. M., 1987, Integration of biostratigraphy and seismic stratigraphy: Pliocene–Pleistocene, Gulf of Mexico: Proceedings, Gulf Coast Section SEPM 8th Annual Research Conference, p. 6–14.
- ↑ Armentrout, J. M., 1991, Paleontological constraints on depositional modeling: examples of integration of biostratigraphy and seismic stratigraphy, Pliocene–Pleistocene, Gulf of Mexico, in P. Weimer, and M. H. Link, eds., Seismic Facies and Sedimentary Processes of Submarine Fans and Turbidite Systems: New York, Springer-Verlag, p. 137–170.
- ↑ 5.0 5.1 Armentrout, J. M., 1996, High-resolution sequence biostratigraphy: examples from the Gulf of Mexico Plio–Pleistocene, in J. Howell, and J. Aiken, eds., High Resolution Sequence stratigraphy: Innovations and Applications: The Geological Society of London Special Publication 104, p. 65–86.
- ↑ Loutit, T. S., J. Hardenbol, P. R. Vail, and G. R. Baum, 1988, Condensed sections: the key to age determination and correlation of continental margin sequences: SEPM Special Publication 42, p. 183–213.
- ↑ 7.0 7.1 Armentrout, J. M., 1993, Relative seal-level variations and fault-salt response: offshore Texas examples: Proceedings, Gulf Coast Section SEPM 14th Annual Research Conference, p. 1–7.
- ↑ Kennett, J. P., K. Elmstrom, and N. Penrose, 1985, The last deglaciation in Orca basin, Gulf of Mexico: high-resolution planktonic foraminiferal changes: Palaeogeography, Palaeoclimatology, Palaeoecology, vol. 50, p. 189–216.
- ↑ Martin, R. E., E. D. Neff, G. W. Johnson, and D. E. Krantz, 1990, Biostratigraphic expression of sequence boundaries in the Pleistocene: the Ericson and Wollin zonation revisited: Proceedings, Gulf Coast Section SEPM 11th Annual Research conference, p. 229–236.