Fault plane profile
| Exploring for Oil and Gas Traps | |

| |
| Series | Treatise in Petroleum Geology |
|---|---|
| Part | Predicting the occurrence of oil and gas traps |
| Chapter | Evaluating top and fault seal |
| Author | Grant M. Skerlec |
| Link | Web page |
| Store | AAPG Store |
A fault plane profile is a cross section in the plane of the fault that shows both the hanging wall and footwall cutoffs.[1][2][3] Fault plane profiles are a fundamental tool for prospect assessment as well as a first step in understanding seal behavior in existing fields. Fault plane profiles are important because they show what is being juxtaposed across the fault. By doing so, they show areas of sand/sand and sand/shale juxtaposition, establish seal relationships, define potential fault-dependent leak points, and help assess hydrocarbon volumes.
An FPP is distinctive in two ways:
- It is a cross section in the plane of the fault rather than normal to the fault.
- Both the hanging wall and footwall stratigraphic cutoffs are shown on the same cross section.
Construction[edit]
We construct an FPP as we do any geologic cross section. Using structure-depth maps, we project the top of each mapped stratigraphic unit at its intersections with the fault plane to its correct depth on the fault plane profile.[2]
Because only a fraction of the stratigraphy is mapped routinely, well logs are used to project the remainder of the detailed stratigraphy onto the FPP.
Example: FPP of cross-leaking fault[edit]
Figure 1 is a simple example of a fault plane profile. The sand reservoirs in the hanging wall (dark gray) and footwall (light gray) are shown on the same cross section drawn in the plane of the fault. In this example, all hydrocarbon accumulations (black) are limited by JLLPs (juxtaposed lithology leak points). Hydrocarbons cross-leak from the footwall sands into the hanging wall sands.
The fault cross-leaks along its entire surface at sand/sand juxtapositions. At each sand/sand juxtaposition, a JLLP spills the hydrocarbons across the fault. There is sufficient charge to fill all closures to a fault-dependent leak point. Potential reservoirs with JLLPs at the crest are dry. The percent fill for other sands is constrained by the JLLPs.[2] If bed dips in the hanging wall allow entrapment against the fault, hydrocarbons could be trapped in both the hanging wall and footwall reservoirs. With sufficient charge, common hydrocarbon contacts could exist.
Example: FFP that cross seals, cross leaks[edit]
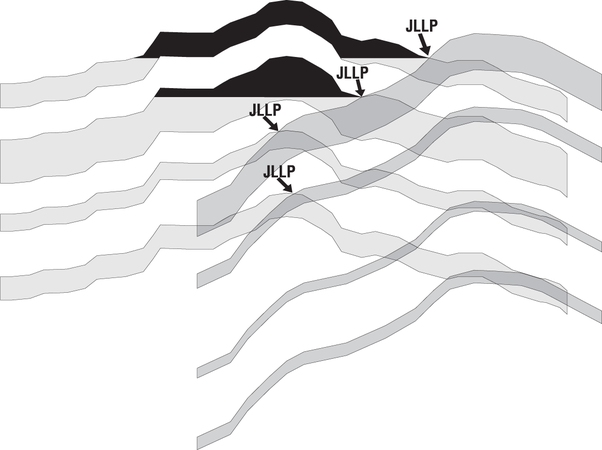
Figure 1 Example of a fault plane profile.
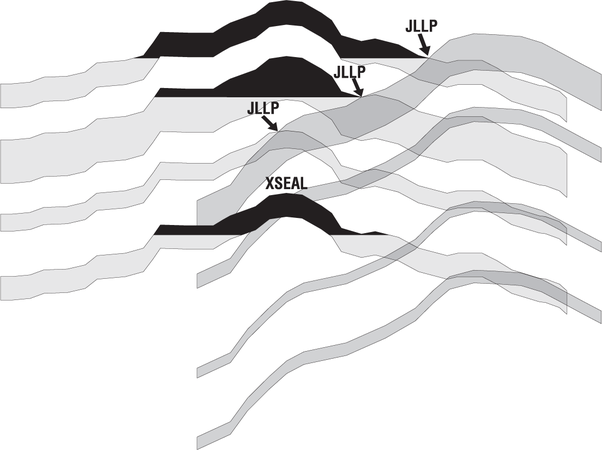
Figure 2 The fault plane profile with cross sealing at the fault/reservoir intersection in the lowest foot-wall sand.
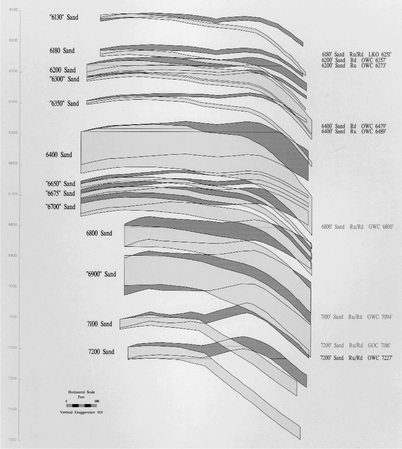
Figure 3 Fault plane profile of a fault in a Gulf Coast field.


The fault plane profile in Figure 2 is similar to the profile in Figure 1 except that the fault is cross sealing at the fault/reservoir intersection in the lowest foot-wall sand. Despite a sand/sand juxtaposition at the crest of this reservoir, the fault traps hydrocarbons at a cross sealing segment. Higher sands continue to cross-leak. The percent fill of the lowest sand is limited by either the displacement pressure (Pd) of the fault zone, the charge volume, or the top seal—not a JLLP.
Figure 3 is an example of a fault plane profile of a fault in a Gulf Coast field.
Pitfalls[edit]
There are three pitfalls to avoid in using fault plane profiles:
- Assuming cross leakage
- Incorrectly projecting bed thickness and bed tops
- Erroneous structural interpretations
Assuming cross leakage[edit]
We must not assume that a fault always cross-leaks at sand/sand juxtapositions. Cross seal is common. If the fault is cross sealing, it is impossible to identify JLLPs from fault plane profiles. Seal behavior can be predicted using quantitative fault seal analysis (refer to Subsection A3).
Plotting bed thickness incorrectly[edit]
if all bed boundaries are taken from mapped surfaces, there are no problems. Because this is almost never the case, problems arise when unmapped bed boundaries, including bed bases, are plotted on fault plane profiles by “isopaching down” from mapped surfaces. Errors arise due to confusion regarding apparent thickness. Errors in bed thickness lead to mistaken identity of what is juxtaposed along the fault as well as mistaken leak points and percent fill.
Construction methods[edit]

Fault plane profiles can be constructed in two different ways:
- Constructed in the plane of the fault
- Projected onto a vertical plane parallel to the fault trace
Figure 1 shows bed cutoffs on the fault plane as well as those projected onto a vertical fault plane profile. The top of the bed is correctly plotted at a depth of depth::1000 ft along both the fault plane and the vertical profile.
Apparent thickness[edit]
Projecting the base of the bed requires determining the correct apparent thickness. The true stratigraphic thickness is H. Several apparent thicknesses are involved:
- Hw—apparent thickness measured in a well log
- Hf—apparent thickness along the plane of the fault
- Hp—apparent thickness along the fault plane profile
Well-log thickness[edit]
Use of the well-log thickness (Hw) to project the base on either fault plane profile clearly gives an incorrect bed thickness at Hp2 in Figure 10-17. Note that H = Hf only because the bed is normal to the fault plane in this specific case. The correct apparent thickness to be plotted on the fault plane profile is Hp1 at depth::1100 ft.
Determining correct thickness[edit]

The correct thickness can be determined from trigonometry[4] or from a simple proportion, as illustrated in Figure 2. The base of the sand is plotted by using a simple proportion between the thickness in the well (Hw) and the distance to the next mapped horizon in the well (Dw), and between the thickness (Hp) on the FPP and the distance to the next mapped horizon on the FPP (Dp):
Erroneous structural interpretation[edit]
The interpretation of the juxtaposition relationships along the fault plane profile is only as good as the original maps. Older 2-D seismic surveys are inadequate unless there is abundant well control. One of the indirect benefits of routine fault seal analysis is that it focuses the explorationist on the details of fault geometry and fault-bed cutoffs that are critical to trap definition as well as to seal analysis. Modern 3-D seismic surveys are essential for reliable risk of fault seal. It is also true that using expensive 3-D seismic surveys only to make top of reservoir structure maps without fault seal analysis wastes a significant part of the information available for prospect assessment.
See also[edit]
References[edit]
- ↑ Van Wijhe, D. H., M. Lutz, and J. P. H. Kaasschieter, 1980, The Rotliegend in the Netherlands and its gas accumulations: Geologie en Minjbouw, vol. 59, no. 1, p. 3–24.
- ↑ 2.0 2.1 2.2 Allan, U. S., 1989, Model for hydrocarbon migration and entrapment within faulted structures: AAPG Bulletin, vol. 72, no. 7, p. 803–811. Cite error: Invalid
<ref>tag; name "ch10r2" defined multiple times with different content - ↑ Hardman, R. F. P., and J. E. Booth, 1989, Structural interpretation of hydrocarbon traps sealed by basement normal fault block faults at stable flank of foredeep basins and at rift basins: AAPG Bulletin, vol. 72, no. 7, p. 813–840.
- ↑ Skerlec, G. M., 1990, SEALS: A short course for risking top seal and fault seal: Franklin, Pennsylvania, SEALS International, 600 p.
External links[edit]
| find literature about Fault plane profile |