Condensate banking effect
| Wiki Write-Off Entry | |
|---|---|

| |
| Author | Asma Al Ahmadi and Rowa Tawfiq |
| Affiliation | Saudi Aramco |
| Competition | 2021 Middle East Wiki Write Off |
Reservoir fluids can be classified into five different categories: black oil, volatile oil, gas condensates, wet gas, and dry gas. The classification of the fluid can be determined by laboratory analysis and from field data. This is summarized Table 1 below. Gas condensate reservoirs usually experience the condensate banking effect. Condensate occurs when either the reservoir pressure of a gas reservoir or the bottom-hole pressure falls below the dew point. Condensate is usually known for impeding productivity, however, different mobility zones occur due to the existence of two phases and the various forces acting upon the rock and fluid. The best approach to understand the performance of a gas condensate well is by analyzing the transient data during pressure build up, which can help to understand the condensate region in terms of its size, mobility reduction, and how it affects the well productivity.
| Reservoir fluid | Field data | Laboratory analysis | |||||
|---|---|---|---|---|---|---|---|
| Initial producing GOR (scf/STB) | Initial API gravity of liquid | Color of stock tank liquid | Mol% of C7+ | Phase change in reservoir | Formation volume factor (bbl/STB) | Reservoir temperature | |
| Black oil | 250-1750 | <45 | Dark | >20 | Bubble point | <2 | <critical temp |
| Volatile oil | 1750-3200 | >40 | Colored | 12.5-20 | Bubble point | <2 | <critical temp |
| Gas condensate | >3200 | 40-60 | Lightly colored | <12.5 | Dew point | - | >critical temp |
| Wet gas | >50,000 | Up to 70 | Water-white | Small amounts | No phase change | - | >cricondentherm |
| Dry gas | - | - | - | - | No phase change | - | >cricondentherm |
Gas condensate reservoirs[edit]
Gas condensate reservoirs are also referred to as retrograde gas reservoirs, duly named in reference to the phase behavior of the fluid, which exhibits retrograde condensation over time (Dandekar, 2006). This can be seen in Figure 1. As gas is produced, the reservoir pressure decreases until it reaches the dew point (point 2), where the first drop of liquid forms. The percent liquid saturation increases as pressure is decreased, reaching a maximum (point 3). The liquid saturation then decreases as pressure is decreased further and the liquid re-vaporizes (red line); exhibiting the referenced retrograde condensation.[1]

Laboratory tests to simulate condensate production[edit]
Two important tests can be performed in the laboratory to simulate and quantify condensate production. Constant Composition Expansion (CCE) and Constant Volume Depletion (CVD) tests. The data obtained from these two tests can aid in determining the PVT properties of the fluid, which consequently supports optimum reservoir engineering decisions, and well performance for the field.[2]
Constant composition expansion (CCE)[edit]
The CCE test entails lowering the pressure in a chamber that contains a sample of reservoir fluid, by increasing the volume of the chamber. The initial pressure of the reservoir fluid is the reservoir pressure and temperature. Pressure is decreased until the first drop of liquid is observed. The pressure where the first drop of liquid is observed, is the dew point pressure. No composition changes occur in this experiment. CCE aids in measuring the Z-factors, oil relative volume below dew point or what is known as the liquid dropout curve, and the dew point pressure.[2] An illustration of the CCE test is shown in Figure 2.

Constant volume depletion (CVD)[edit]
The CVD test simulates pressure depletion in a gas condensate reservoir. The CVD test entails decreasing the pressure, in increments, below the dew point by increasing the volume of the chamber. At each pressure increment, the gas that is produced as a consequence of pressure depletion, is released from the top of the chamber. The chamber volume remains constant at the end of each step. In essence this is simulating the exact conditions in an actual reservoir. The volume of the effluent gas is measured, as well as its composition and Z-factor. The remaining fluid in the chamber is also measured. The CVD test, as opposed to the CCE test, involves a change in composition. The measurements from the CVD test are necessary to estimate condensate recovery.[2]. An illustration of a typical CVD experiment is shown in Figure 3.

Condensate banking[edit]
Condensate can still form when the reservoir pressure is above the dew point, but the bottom-hole pressure in the wellbore is below the dew point. This causes condensate to form around and near the wellbore, causing a bank or ring of condensate. As long as the reservoir pressure is above the dew point, the effects of the condensate ring around the wellbore can be overlooked in certain cases and do not have much effect on productivity. However, when the reservoir pressure drops below the dew point, the liquid saturation increases within the reservoir and then forms the condensate bank around the wellbore and at the same time, condensate is also present in the reservoir. This has significant effects on well productivity, mainly due to the decreased relative permeability to gas.[4]
Evaluation of condensate banking and its effect on productivity[edit]
The effect of condensate banking on productivity is dependent on multiple factors, including the petrophysical properties of the rock as well as the properties of the fluid and the effect of different forces acting upon the rock and fluid. Once condensate starts to form, it will preferentially start to migrate into small pores due to capillary forces. This initial formation of condensate does not affect productivity significantly as the condensate occupies the smaller pores and thus frees the larger pathways for gas to flow freely into the wellbore. With time and as condensate production increases with pressure depletion, the condensate occupies larger pores, significantly reducing the ability of gas to flow, and hence reducing the productivity of the well.[5] As mentioned, the concentration of liquid and hence the productivity is dependent on the petrophysical properties of the rock. In lower permeability and lower porosity reservoirs, condensate banking effect is more significant due to the shortage of well-connected and large pores, where condensate will most likely dominate the pore space and thus reduce productivity.
Condensate banking profile near the wellbore vicinity[edit]
With the effect of condensate banking, a two-phase region is created, where gas and liquid exist. This causes different condensate mobility zones to exist in the near-wellbore region. Figure 4 demonstrates this phenomena, where three zones exist.
- Single-phase Zone: (Zone 3) In a situation where reservoir pressure (P) is above the dew point pressure (Pdew), the liquid saturation (So) is at the original liquid saturation of the reservoir, which is observed further away from the wellbore. No condensate is present in this zone and only gas is mobile.
- Condensate Buildup Zone: (Zone 2) As we move closer to the wellbore, the reservoir pressure is now below the dew point pressure and liquid saturation is variant. However, only gas is mobile in this region, as the liquid condensate saturation is still below the critical condensate saturation point and therefore the liquid condensate is immobile.
- Near Wellbore Zone: (Zone 1) Finally, closer to the wellbore, both phases (condensate and gas) exist and gas will continue to produce, while condensate is considered to have low mobility. Condensate will only start to produce when the liquid saturation reaches the critical condensate saturation.[4] [6]
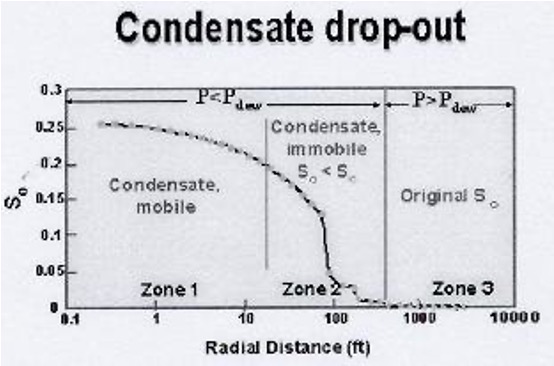
Figure 4 Condensate saturation versus radial distance from wellbore, with different condensate mobility zones.[6]
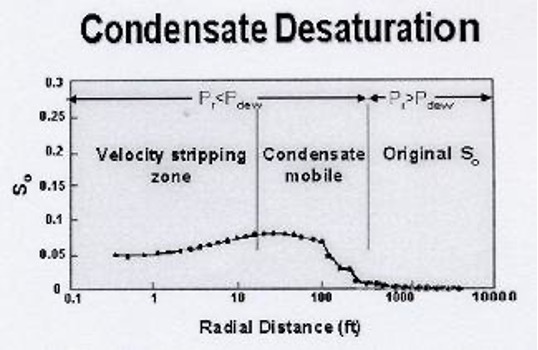
Figure 5 Condensate saturation versus radial distance from wellbore, with velocity stripping zone.[6]
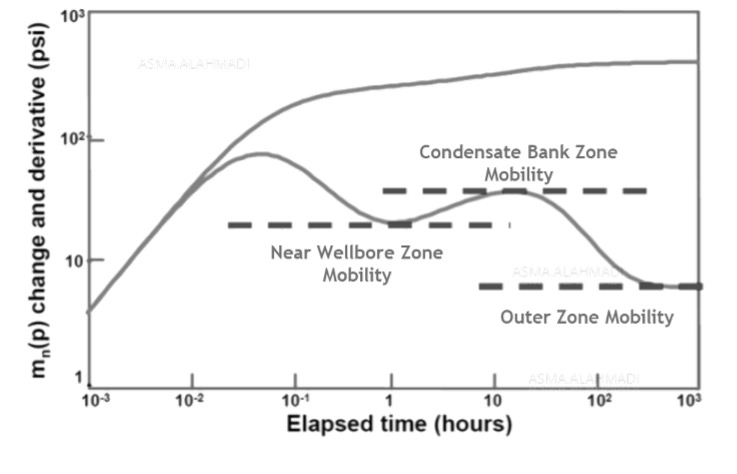
Figure 6 Pressure derivative response of gas condensate well producing below the dew point.[7]


Increased gas mobility is observed in the near wellbore region mainly due the compositional changes occurring. As the heavier components increase, this increases the viscosity of the liquid, whereas the gas becomes less viscous. This increases the relative mobility of the gas with respect to the liquid condensate. This increase in gas mobility is observed at higher velocities, and thus is termed the velocity stripping effect, which can increase the productivity of a well. This can further be demonstrated in Figure 5.[6]
The velocity stripping effect is also termed “viscous” stripping due to the effects of viscosity on productivity as explained earlier. The increase in gas mobility due to velocity stripping occurs as a result of high capillary number. The capillary number (Nc), as defined in Equation 1 below, is the ratio of viscous forces to capillary forces.

Where ν is the gas velocity, µ is the gas viscosity, and σ is the interfacial tension between the gas and liquid. As such, with higher velocities and lower interfacial tensions, a high capillary number is obtained and velocity stripping is observed.[8]
Another effect is also present at high velocities, which acts against the velocity stripping effect. This effect is termed the Inertial (non-Darcy) flow effects, which, at high velocities, reduces effective gas permeability and leads to lower well productivity. On the other hand, velocity stripping increases the relative permeability. However, it has been observed in most gas-condensate wells that relative permeability effects are dominant, hence an increase in productivity is usually observed in these wells.[8]
Well test analysis of condensate banking in gas wells[edit]
A primary approach to understand the well and reservoir performance is through conducting a well test analysis. In a producing well, critical parameters such as permeability, reservoir pressure, heterogeneity, and reservoir boundaries can be identified by the measured rate and pressure data. The transient pressure testing analysis mainly consists of analyzing a plot that is a function of pressure versus a function of time called a “pressure derivative plot”. A pressure derivative response can tell as much as the flow regime of a producing well, which then can be evaluated through an interpretation model to better describe the well and reservoir behavior.

The accumulation of the condensate around the wellbore when a well produces below the dew point can be identified and quantified through well test analysis.[10] The effect of condensate banking is usually observed and has a major impact on the pressure derivative response. This impact corresponds to the changes of gas mobility zones due to the changes in gas relative permeability around the wellbore. It is important to understand the expected derivative shape for a well with condensate banking, and understand the composite behavior created by the condensate saturation and liquid buildup. Figure 6 shows a typical pressure derivative response for a well producing below the dew point pressure.
The existence of a two phase system around the wellbore reduces the gas mobility, which restricts the flow of gas into the wellbore. That said, a fourth region forms which was discussed earlier, “velocity stripping”, which is in the immediate vicinity of the well where liquid saturation decreases and gas relative permeability increases as shown in Figure 7.[11] At the velocity stripping region, the gas mobility is improved compared to that in the bank due to the high capillary number at high production rates.
Although from a theoretical point of view, a fourth region exists, there has not been many evidence of its effect on the pressure derivative response. In fact, all four regions appear as three different mobility zones, [11] creating a composite radial behavior with three stabilizations in a pressure derivative as seen previously in Figure 6.

Well test analysis using radial composite model[edit]
The first stabilization represents the region closer to the wellbore where liquid saturation reaches the critical condensate saturation and condensate becomes mobile (gas and condensate flow simultaneously). The second stabilization corresponds to the condensate bank region indicating high condensate saturation and lower mobility. The third stabilization represents the region away from the wellbore, which has the initial liquid saturation and only single-phase gas flowing.
Radial composite model is a practical solution for determining the condition of condensate banking based on analytical or numerical interpretation results. When reservoir petrophysical properties, such as permeability, thickness, compressibility, and viscosity change at a distance from the wellbore, composite systems are typically used to capture the distinct regions around the wellbore. Each distinct region is simulated by altering the mobility and diffusivity ratios. The model assumes a well is at the center of a circular zone and rf is the radius of the inner compartment as seen in Figure 8.
The radial change of properties in different regions around the well are mainly governed by two parameters, defined by an inner region compared to an outer region. These are the mobility and diffusivity ratios shown in Equations 2 and 3, respectively.
The mobility ratio
M=〖(k/µ)〗in/〖(k/µ)〗out (2)
The diffusivity ratio
D=〖(k/(φµct))〗in/〖(k/(φµct))〗out (3)
Where k is the permeability, µ is the fluid viscosity, ct is the compressibility, and φ is the porosity.

A mobility ratio equal to 1 indicates there is no reservoir property change from one region to another, and the reservoir can be considered homogenous. For greater values of mobility ratios (M>1) this indicates a decrease in mobility from inner region to outer region (mobility of outer region is reduced). However, for mobility ratios less than 1 (M<1), this indicates an increase in mobility from inner to outer region.[12] Figure 9 shows the impact of various mobility ratios (M) on a pressure derivative for a two region radial composite reservoir. Although both parameters (M & D) should be considered when applying the composite models, mobility ratios (M) have a larger impact on the composite model compared to the diffusivity ratio (D).
Minimizing condensate banking effect[edit]
Gas condensate reservoirs are prone to formation damage due to condensate banking. The accumulation of liquid will act as a blockage and result in a decrease in both gas relative permeability and mobility in the near wellbore vicinity, and therefore, reducing wellbore productivity. An effective approach to minimize the condensate bank around the wellbore is to maintain the flowing bottom-hole pressure as close as possible to the dew point pressure. This can be done by lowering the production rate of a well, thus, lowering the condensate dropout.

Figure 10 illustrates the condensate well test behavior with increasing and decreasing flow rates. At the start of a production, and as long as the pressure remains above the dew point pressure, only gas is observed flowing into the wellbore. The pressure derivative of the first and second drawdowns (Dd1& Dd2) exhibits a homogenous behavior as expected from a dry gas. However, as production time increases, the flowing bottom-hole pressure will start to drop below the dew point pressure generating a small condensate accumulation around the wellbore. Bu3 & Bu4 shows a pressure derivative response corresponding to the minor effect of the increase of condensate saturation in the well. As we keep producing below the dew point, flowing bottom-hole pressure drops significantly causing more condensate to dropout, and therefore, more prominent condensate banking effect on the pressure derivative as seen in the remaining buildups.[10] This process can be reversed by lowering the production rates, so that the flowing bottom-hole pressure is maintained above or closer to dew point critical pressure as possible.
Other techniques include using solvents and wettability-alteration chemicals to reduce the impact of condensate blockage. Also, hydraulic fracturing and acidizing showed to be effective in minimizing the condensate bank; thus, improving the well productivity.
See also[edit]
- 2021 Middle East Wiki Write Off
- Super basins
- Structural restoration
- Fault seal analysis for reservoir development
References[edit]
- ↑ 1.0 1.1 Parvizi, H. (2009). Field Operational Problems due to Condensate Formation in Retrograde Gas Reservoirs . Ahwaz: Petroleum University of Technology.
- ↑ 2.0 2.1 2.2 Whitson, C. H., Fevang, Ø., & Yang, T. (1999). Gas Condensate PVT-What's Really Important and Why? IBC Conference. London: IBC UK Conferences Ltd.
- ↑ 3.0 3.1 Panja, P., Velasco, R., & Deo, M. (2020). Understanding and Modeling of Gas-Condensate Flow in Porous Media. Advances in Geo-Energy Research, 173-186.
- ↑ 4.0 4.1 Shi, C. (2009). Flow Behavior of Gas-Condensate Wells. Stanford University.
- ↑ Hinchman, S. B., & Baree, R. D. (1985). Productivity Loss in Gas Condensate Reservoirs. 60th Annual Technical Conference and Exhibition of the Society of Petroleum Engineers . Las Vegas: SPE 14203.
- ↑ 6.0 6.1 6.2 6.3 Daungkaew, S., & Gringarten, A. (2004). The Effect of Capillary Number on a Condensate Blockage in Gas Condensate Reservoirs . Walailak Journal Science and Technology, 91-116.
- ↑ Halim, A., Nuri, F., & Adi P, S. (2015). Analysis Of Condensate Banking Indication Of “M” Gas Condensate Reservoir From Welltesting Examination. Thirty-Ninth Annual Convention & Exhibition. Indonesian Petroleum Association.
- ↑ 8.0 8.1 Mott, R., Cable, A., & Spearing, M. (2000). Measurments and Simulation of Inertial and High Capillary Number Flow Phenomena in Gas-Condensate Relative Permeability . SPE Annual Technical Conference Exhibition. Dallas: SPE 62932.
- ↑ A.C. Gringarten , O. Ogunrewo, & G. Uxukbayev. (2011). Assessment of Rate-Dependent Skin Factors in Gas Condensate and Volatile Oil Wells. Vienna: 2011 SPE EUROPEC/EAGE Annual Conference and Exhibition.
- ↑ 10.0 10.1 10.2 Gringarten, A., M. B., S. D., & A. H. (2006). Well Test Analysis Lean Gas Condensate Reservoirs: Theory and Practice . Moscow: SPE Russian Oil and Gas Technical Conference and Exhibition.
- ↑ 11.0 11.1 A. C. Gringarten, A. Al-Lamki, & S. Daungkaew. (2000). Well Test Analysis in Gas-Condensate Reservoirs. Dallas: 2000 SPE Annual Technical Conference.
- ↑ 12.0 12.1 Liu, Q., Lu, H., Li, L., & Mu, A. (2018). Study on characteristics of well-test type curves for composite reservoir with sealing faults. Advancing Research Evolving Science.
- ↑ Houze, O., Viturat, D., & Fjaere, O. S. (2018). Dynamic Data Analysis. KAPPA.