Fault seal analysis for reservoir development
| Wiki Write-Off Entry | |
|---|---|

| |
| Author | Alfian Gilang Gumelar |
| Affiliation | BitCan Geoscience & Engineering Inc. |
| Competition | 2021 Middle East Wiki Write Off |
Fault seal analysis is used to determine the level of connectivity of a separate reservoir due to fault segments. This is controlled by the permeability and porosity parameters of rocks that are in the fault section. Fault segment that becomes insulating if it has high porosity and permeability values will channel hydrocarbon fluid to the surface. So that the fault is one of the traps that are good for hydrocarbons. There is a mechanism where a fault can be a seal of fluid [1][2]:
- Juxtaposition position alignment, where the sandstone reservoir is aligned with rocks that have low permeability (clay / shale) with high pressure (Figure 1).
- Clay smear, where the clay enters the fault plane and puts high pressure.
- Cataclastic, where sandstone is crushed so that the grains of sand material enter the fault plane with high capillary pressure.
- Diagenesis, where cementation that occurs in the partial fault plane / can also completely cover porosity so that the field becomes permeable.
Fault Seal Analysis method has key factors that are vertical movement (throw) and shale or clay content (Vshale) in the rocks involved in faulting[3]. One method of quantity is the Shale Gouge Ratio (SGR) and Hydrocarbon Column Height (HCH) which will analyze fault characteristics (Figure 2).
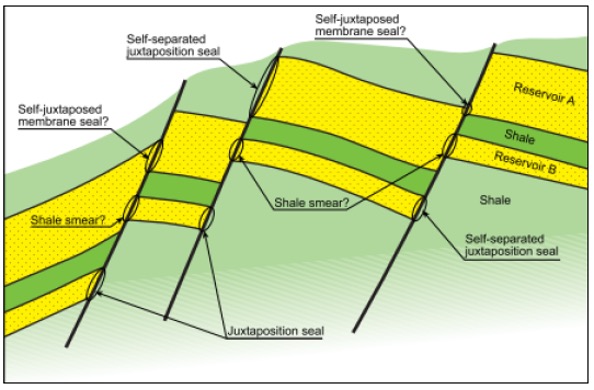
Figure 1 Schematic illustration showing the presence of hydrocarbon traps (fault blocks) of normal faults by the interbedded between sandstones and shale (modified from [4]).]]
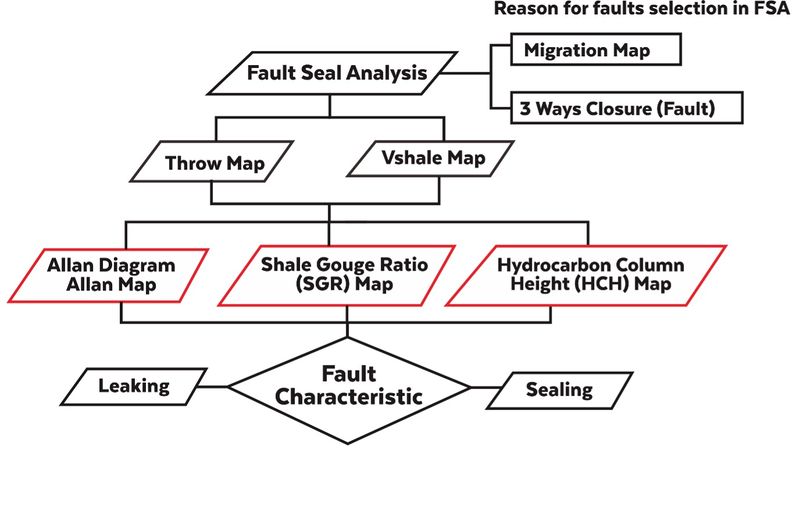
Figure 2 Fault seal analysis flowchart.


Juxtaposition analysis
One of the mechanisms of the process of hydrocarbon insufficiency is juxtaposition. This barrier is caused by the presence of rocks that have different physical properties of rocks, namely permeability and porosity. Rocks that have greater permeability and porosity will not flow hydrocarbons in the direction of smaller permeability and porosity. If the sandstone is in contact with the claystone then a juxtaposition seal is possible because the physical parameters of the claystone do not allow fluid to pass through the rock.
The first order of seal analysis cannot be separated from identifying the juxtaposition of the reservoir in all fracture planes by using layers of interpretation results that have been defined on the fracture plane[5]. It is seen in Figure 3 that in several ways that hydrocarbon fluids can escape. In the top illustration, there is a juxtaposition seal, which means that there is a barrier which is a concern for rocks with low permeability and reservoir. The middle illustration shows that sand to sand juxtaposition which can occur due to the nature of relatively similar permeability. The bottom illustration shows the reactivation of a fault, so that it can become a hydrocarbon migration pathway. Because faults can form porosity which results in the opening of a new fault plane.

Allan diagram
Allan[6] developed a graphic technique to map the relative position of the lithology cut-offs on both the footwall and the hanging-wall. This methodology is often called Allan Mapping. Using this approach, cross-fault spill points and hydrocarbon flow path potential can be determined from the lithological alignment (juxtaposition), based on the assumption that the fault itself does not have sealing properties and that it is not an open channel for flow. Allan's mapping relies on the construction of the fault surface section (Figure 4) which is defined as the appearance of the stratigraphic geometry that touches across the fault by removing the hanging-wall[6]. The representation of a part of the fault surface is often a vertical or planar surface. The lithology of the footwall and hanging-wall fault blocks is projected onto the surface portion of the fault and is used to determine where the reservoir lithology of one fault block is juxtaposed with the non-reservoir lithology of the opposite fault block.

Allan's Mapping Technique produces a two-dimensional model of the 3-D fault surface. It is a static model showing the lithological cut-off relationship across the fault surface for a specific temporal stage in the fault deformation history. Therefore, this model is less used in distinguishing cross-fault lithology relationships for other temporal stages in the structural evolution of faults. Knipe[7] introduced a technique known as the Juxtaposition Diagram (Figure 5) which can be used to determine the relative alignment of the lithology for each structural configuration. This technique uses a one-dimensional stratigraphic column of the footwall at a single spatial point along the length of the fault surface, vertically offsetting itself, to construct a diagram showing the relative alignment of the lithology across faults for a hanging-wall thrown between zero and maximum (usually equal to vertical thickness. stratigraphic column). Subject to the assumption that the footwall and hanging-wall stratigraphy are identical, the alignment relationship for the number of throwlines can be ascertained by dropping the throwline through the corresponding position on the diagram (Figure 5) using this technique, the alignment of the relationship positions at any point in time in the structural evolution of the fault can be investigated.

Clay smear calculation
Clay smear is clay that is found in the fault segment and is one of the inhibiting factors for hydrocarbon migration. However, according to Yielding et al.[3] there are factors that determine the formation of clay smears, namely:
- Thick coated claystone will result in a thicker clay spread.
- The thickness of the clay smear decreases the further it is from the source layer of the clay.
- Clay smear will get thinner with increasing distance of the vertical fault displacement (throw).
- The more claystone layers that are affected by faults will produce a continuous smear.
According to Yielding et al.[3], calculations to approach fault sealing analysis by combining certain parameters are (Figure 6 and Figure 7):
- Shale Smear Factor (SSF) or clay smear factor is how far the vertical displacement is to the thickness of the claystone that is cut by the fault, and SSF does not become a seal if it is > 7. SSF is considered effective when applied to a simple single fault plane (not multiple fault planes) and only one clay layer is enlarged[8].

- Shale Gouge Ratio (SGR) or the ratio of crushed clay is the percentage thickness of the clay layer that is in the fault segment to the vertical displacement (throw). The higher the SGR value, the more potential it becomes a barrier.

- Clay Smear Potential (CSP) is the amount of clay present in the fault segment which is given to each layer of clay that is cut by the fault. The more the CSP value, the further the displacement is indicated.

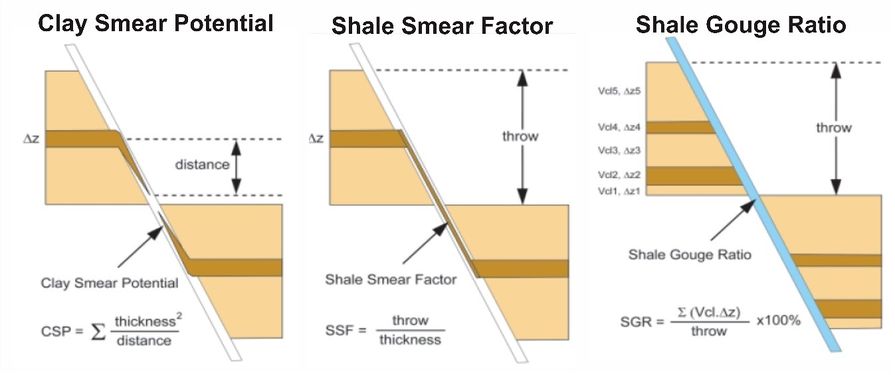
Figure 6 Displacement factor algorithm for estimating clay smears in the fault plane. (a) Potential Clay Smear; (b) Shale Gouge Ratio; (c) Shale Smear Factor (redrawn from Yielding et al.[3]).
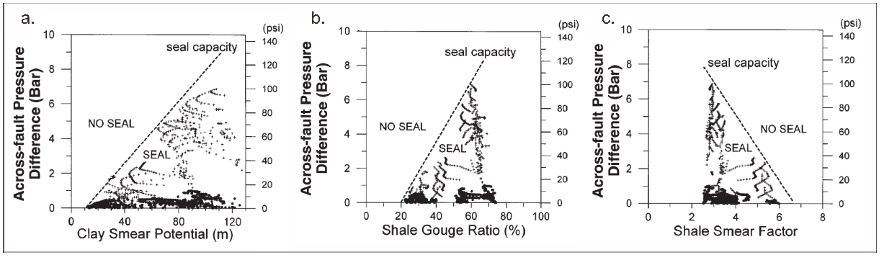
Figure 7 Plot of parameter relationship with formation ability for sealing capacity in reservoir (a) Clay Smear Potential; (b) Shale Gouge Ratio; (c) Shale Smear Factor [3].


Hydrocarbon column height (HCH)
Analysis of hydrocarbon column height is a calculation to determine the resistance of a point in the fault plane to withstand hydrocarbons in the thickness domain (meters / feet). According to Schofield[9] hydrocarbon column height is affected in three main things, namely:
- Limited by structure, directly affects the filling of hydrocarbons into the reservoir. The main effect is structurally limited to the elevation area (Figure 8).
- Limited by volumetric, this factor involves the lack of ingress of accumulated hydrocarbons into the trap. In this case it may be that the source rock is not producing sufficiently to fill the reservoir and the effect of migration pathways which have varying permeability becomes an obstacle for the accumulation of hydrocarbons.
- Geomechanics, related to the deformation of the cap rock that covers the hydrocarbons. In this case, it has the influence of matrix capillary control and control of the rupture of the hood rock[9]. According to Schowalter[10], it has been estimated that the minimum caprock membrane failure value of oil saturation is between 4.5 - 17% with an average of 10% based on buoyancy pressure and capillary pressure based on laboratory experiments.

To make a relationship between shale gouge ratio (SGR) and hydrocarbon column height (HCH), Bretan, et al.[11] estimate the empirical formula taking into account the across-fault pressure difference (AFPD) and produces the following formula:

With:
- H = hydrocarbon column height (m /ft, where 1 m = 3,2808 ft)
- g = gravity (9.81 ms-2)
- ρw = pore density of water (kg /m3)
- ρh = density of hydrocarbons (kg /m3)
Figure 9 is the relationship between SGR and HCH values, with this table estimating the HCH value using SGR data. From this image, it can also test the quality of the resulting data. With different parameters, Bretan, et al.[11] made an empirical formula so as to connect SGR and HCH. Because SGR has a benchmark with the value of VShale but the HCH is added with the parameters of the hydrocarbon density and pressure. So that one of its uses is that it can be used as a quality control analysis.

See also
References
- ↑ Watts, N., 1987, Theoretical aspects of cap-rock and fault seals for single- and two-phase hydrocarbon columns: Marine and Petroleum Geology, v. 4, p. 274–307.
- ↑ Knipe, R. J., 1992, Faulting processes and fault seal, in R. M. Larsen, H. Brekke, B. T. Larsen, and E. Talleraas, eds., Structural and tectonic modelling and its application to petroleum geology: Proceedings of Norwegian Petroleum Society Workshop, 18-20 October 1989, Stavanger, Norway, p. 325-342.
- ↑ 3.0 3.1 3.2 3.3 3.4 Yielding, G., B. Freeman, and D. T. Needham, 1997, Quantitative fault seal prediction: AAPG Bulletin, v. 81, no. 6, p. 897-917.
- ↑ Færseth, R. B., 2006. Shale smear along large faults: Continuity of smear and the fault seal capacity: Journal of the Geological Society, v. 163, no. 5, p. 741-751.
- ↑ 5.0 5.1 Yielding, G., P. Bretan, and B. Freeman, 2010, Fault seal calibration: A brief review, in S. J. Jolley, Q. J. Fisher, R. B. Ainsworth, P. J. Vrolijk, and S. Delisle, eds., Reservoir compartmentalization: Geological Society (London) Special Publication 347, p. 243-255.
- ↑ 6.0 6.1 6.2 Allan, U. S. 1989, Model for hydrocarbon migration and entrapment within faulted structures: AAPG Bulletin, v. 73, p. 803–811.
- ↑ 7.0 7.1 Knipe, R. J., 1997, Juxtaposition and seal diagrams to help analyze fault seals in hydrocarbon reservoirs: AAPG Bulletin, v. 81, p. 187-195.
- ↑ Fossen, H., 2010, Structural Geology: Cambridge University Press, Cambridge, 463 p.
- ↑ 9.0 9.1 9.2 Schofield, James K., 2016, Relationships between Observed Hydrocarbon Column Heights, Occurrence of Background Overpressure and Seal Capacity within North West Europe: Thesis.
- ↑ Schowalter, T. T. 1979, Mechanics of secondary hydrocarbon migration and entrapment: AAPG Bulletin, v. 63, no. 5, p. 723-760.
- ↑ 11.0 11.1 11.2 Bretan, P., G. Yielding, and H. Jones, 2003, Using calibrated shale gouge ratio to estimate hydrocarbon column heights: AAPG Bulletin, v. 87, no. 3, p. 397-413.