Cross-well electromagnetic tomography monitoring of fluid distribution
| Wiki Write-Off Entry | |
|---|---|

| |
| Author | Sara Abu Alsaud and Klemens Katterbauer |
| Affiliation | Saudi Aramco |
| Competition | 2021 Middle East Wiki Write Off |
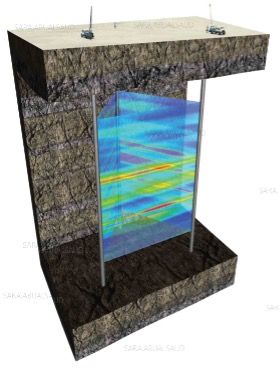
Cross-well electromagnetic (EM) tomography is a cross-sectional electrical imaging method used to evaluate the fluid distribution between two or more wells in the formation (Figure 1). The main objective of using this technology is to distinguish between different types of rock pore fluids by using the fluid conductivity analogy as a determining factor. Knowing the fluid content and distribution is essential in calculating the original hydrocarbon in place, in which the fluid conductivity is determined by the type of fluid present, whether it is water, oil, or gas. Afterward, the water saturation is empirically determined from the measured water resistivity. Unlike the traditional resistivity logging tools, the cross-well EM tomography measures the resistivity distance away from the borehole passing areas close to the invaded zone. This capability is essential when surveying fields that have been in production for an extended period of time. This technology plays a critical role in monitoring the fluid movement between the wells.
Cross-well EM tomography have many usages and applications, but it is mainly used in:
- Bypassed hydrocarbon identifications.
- Reservoir surveillance.
- Sweep efficiency monitoring.
- Reservoir simulations improvements.
- Reservoir heterogeneity mapping.
- Infill drilling planning and production optimizations.
- Thermal enhanced oil recovery monitoring.
Theory
Cross-well EM devices are an extension of the resistivity logging tools. These tools measure the conductivity of the formation, where its reciprocals give the resistivity. The measurements are presented by a resistivity log, which is a plot of resistivity versus depth. The resistivity log reflects the nature of hydrocarbon presence in the penetrated formation. The basis behind the measurements is the conductivity and insulation concepts. Conductive materials pass electrical current easily compared to insulators. In the formation, water is an electrolyte. An electrolyte is an electrically conducting solution that contains dissolved cations and anions. These ions help pass electrical currents through the formation. In contrast, completely dry rocks are insulators, which give incredibly large resistivity.
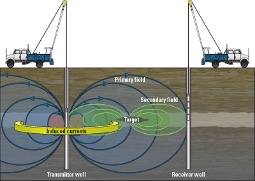
Resistivity devices are divided into two primary types, electrode (galvanic) devices, and induction devices. Electrode devices measure the electrical potential (voltage) of the passing electrical current. For the measurement to take place, the electrodes should be within a water-based mud, specifically salty water. The induction devices use an alternating current to generate an alternating primary magnetic field that induces a current into the formation. Then, the induced current generates a secondary magnetic field that is measured by the coils. The induction device's advantage over the electrode devices is that it is used in an oil-based mud or a relatively low conductive mud, like freshwater-based mud.[3]
The cross-well EM system falls under the induction devices, but instead of having the transmitter and receiver in a single logging tool, the transmitter and receiver are two isolated entities, in which the transmitter is in one well, and the receiver is in another. The magnetic fields and induction currents visuals are demonstrated in Figure 2.
Theoretical Design of a Cross-well EM system
Waves propagation into the formation depends on the amount of frequency used, since the reservoir is further away from the borehole, a high wave frequency, in the MHz, can only give information near the borehole. Therefore, a lower frequency system is used due to its high wavelength, which ultimately results in a higher depth of investigation. The wave propagation concept is applied together with the diffusion equation to design the EM system.
The EM regions between the source and receiver shaped like a quasi-ellipse. The primary EM fields are considered to be uniformed and are donated as the background conductivity of the medium (σb). The source receiver sensitivity between the wells are measured by perturbing a small volume or a point in the quasi ellipse region. This perturbation results in having a non-uniform secondary EM field. As a result, the disturbed secondary field is calculated by using the Fréchet derivative.[4] [5] The result of the Fréchet derivative is displayed in equation (1), which represent the magnetic field sensitivity.
Equation (1) KHz = σb Ghz Eϕb
The receiver magnetic flux density is obtained by the following equation:
Equation (2) Hz = (-M)/(4πr^3 ) e(-ikb r) (1+ikb r-kb2 r2 )
Equation (3) kb2=ω2 με + iσb ωμ
The first term in equation (3) is negligible due to its small contribution kb. By using both equations (2) and (3), the minimum transmitter dipole moment can be calculated.
| Symbol | Definition | Unit | SI Base Unit |
|---|---|---|---|
| KHz | Magnetic field sensitivity function | - | - |
| Eϕb | Tangential electric field | Volts per meter (V/m) | m.kg s-3 A-1 |
| σb | Background conductivity | Siemens per meter (S/m) | kg-1.m-3 A-1 |
| Ghz | Greens function magnetic field | - | - |
| Hz | Magnetic flux density in the z-direction | Tesla (T) | kg.s-2.A-1 |
| kb | Background medium propagation constant | - | - |
| M | Transmitter dipole moment | Ampere-squared meter (A.m2 | A.m2 |
| r | Distance between the wells | Meter (m) | m |
| ε | Permittivity | Farad per meter (F/m) | kg-1.m-3.s4.A2 |
| ω | Frequency | Radians/second | s-1 |
| μ | Magnetic material permeability | Henries per meter (H/m) | kg.m.s-2.A-2 |
| i | Unit imaginary number √(-1) | - | - |
Instrument Design of the EM System
In the early 1970s, the Lawrence Livermore National Laboratory (LLNL) developed the first-ever high-frequency cross-well electromagnetic system using electric dipole sensors. These sensors were intended primarily for hard rock, either igneous or metamorphic rocks, and tunnel detection. Due to the initial EM system high frequency and high conductivity regions in the reservoirs, the signals can only propagate a few inches into the formation (small depth of investigation). Thus, to measure the resistivity of the formation by using this technology, a low-frequency EM system is needed. However, the emitting signals are highly diffusive so, it is difficult to map the data. Based on this situation, the LLNL, together with the University of California-Berkley (UC-Berkley), extended the work on the induction logging tools to create the cross-well EM tomography.[6]
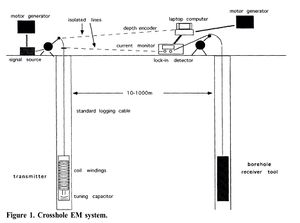
The LLNL and UC-Berkley team tested this technology by using very simplistic tools (see Figure 3). The system worked by sending a high alternating current from the source on the surface down the logging cable to the transmitter. The transmitter is made of a magnetic core wrapped with a wire, and it is tuned with a capacitor. To achieve the optimum single operating frequency suitable for the borehole condition, the coil is tuned by either replacing the capacitor or/and increasing/decreasing the number of turns around the magnetic core. The research team tested different frequencies to reach the optimum resolution and range. The antenna detects the emitted signal from the transmitter in the receiver located in the other borehole. The signal is then sent uphole through the logging cable to the lock-in detector to decode the signal. The received signal is coupled with the source signal with an isolated wireline for configuration. The transmitter and receiver are two isolated structures, where each one has its generator. The only way to connect these coils is by a surface isolated cable. This kind of separation is vital for generating high-quality data and minimizing the earth loops' noise. In the borehole, the logged information is between an interval of depths, so to log the data, multiple receivers stay at a separated interval while the transmitter travels upward at a constant velocity. Following this technique, a complete cross-well tomography is generated.[7][6]
The team did two field trials in Richmond, California, where the distance between the two wells is 50 m, the other in Devine, Texas, where the wells are 100 m apart. The Richmond test targeted a shallower depth compared to the Devine trial, and the EM system was used to monitor the injected saltwater.[7] [6]
The design standards of the cross-well EM system are mainly described by the following:
- Operating frequency.
- Receiver sensitivity.
- Optimum transmitter power.
- Borehole dimensions.
- Weights.
- Durability to borehole conditions.
An example of the EM design specification is shown in Table 2.
| Transmitter (TX) | Receiver (RX) | Notes | |
|---|---|---|---|
| Frequency | 5-1000 Hz | 5-1000 Hz | Harmonics > 1000 Hz |
| Logging Speed | Typical 2000-5000 ft/hr | Stationary (tomography) | TX speed adjusted to meet required signal-to-noise ratio |
| Length | 9.88 m (32.4 ft) | 22.50 m (83.8 ft) | Tool string length |
| Diameter | 3.375 in. | 2.125 in. | - |
| Weight | 410 lb | 416 lb | Receiver weight is for 4 receiver strings |
| Temperature | 150 deg C (302 F) | 150 deg C (302 F) | - |
| Pressure | 20 kpsi | 15 kpsi | - |
Relation to Fluid Distribution Mapping
Resistivity measurements reflect the nature of hydrocarbon presence in the penetrated formation by relating it to an essential petrophysical property, which is water saturation. The relationship between the electrical resistivity of a porous rock to the water saturation was studied for a long time. Unfortunately, quantitively addressing the water saturation is a challenge, where all of the models generated and used are based on observations and experiments. Archie’s work on water saturation interpretation was a significant milestone in the industry. Through several experiments, Archie was able to observe a constant relationship between the measured (Ro) and saltwater (Rw) resistivities called the formation factor (F). Later on, Archie extended his work and found a relationship between the formation factor and the porosity (ϕ). Archie further his experiments by combining his formula with the power relationship that he observed from previous data used by Leverett and others. So, the known Archie’s equation is represented as follows:
Equation (4) Swn = (aRw)/(ϕm Rt )
Where n is the saturation exponent, m is the cementation factor, a is the tortuosity, Rt is the measured formation resistivity in ohm-m, and Sw is the water saturation.[8] The rock and fluid properties are taking from cores or/and logs.
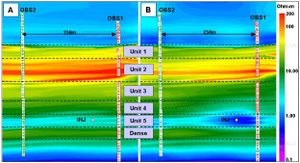
From the cross-sectional measurements of the inter well EM data (see Figure 5 and Figure 6) taking together with the porosity from logs and cores, the water saturation can be interpolated by using Archie’s equation.
Pattern Water Injection Pilot
In 2008, a pilot was done on the lower cretaceous heterogeneous carbonate reservoir in the United Arab Emirates. The pilot targeted both the Kharaib and Shuaiba formations in the Thamama series. With the continuation of oil production, pressure will deplete. Therefore, a continuous water injection job is needed to maintain the reservoir pressure and enhance recoverable oil. Due to the altered carbonate texture of the formation, which affects both the porosity and permeability, the movement of the interface between the injected water and the oil is uneven. Also, the formation resistivity of each layer changes, and with water injection, the resistivity changes with time. As a result, a sophisticated flood front monitoring tool is essential to improve the oil recovery from the reservoir, monitor the patterned water flooding job, and determine water breakthrough.[9]
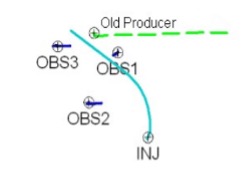
A cross-well EM monitoring technique was suggested to utilize the inverted five-spot water injection pattern. The project was done using three vertical observers, one horizontal water injector, and an existing oil producer. The drilled observer’ wells were cased with chrome to demolish the effect of the magnetic casing on the EM measurements. The triangular configuration of the observers provided a reasonably good volumetric coverage of the region (see Figure 4).[9]
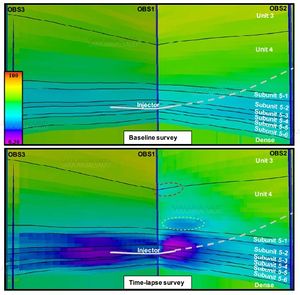
The time-lapse EM resistivity was created, as seen in Figure 5 and Figure 6, where the cross-well EM data were processed and interpolated. Figure 5 shows an example of all the layers (units) between the observer OBS1 and OBS2. A similar image can be constructed between OBS 1-OBS3, and OBS2-OBS3. Figure 6 shows a zoomed-in version of the EM tomography focusing on units 3,4 and 5. As seen in both figures, the resistivity decreases around the injector in a horizonal ellipsoidal manner. Between OBS3-1 the water is contained in unit 5, whereas OBS1-2 the injected water slightly affects the resistivity of unit 4. This shows that there is a possibility of a fracture connecting layer 5 with 4. Hence, the water migrates vertically causing a decrease in resistivity. All in all, the EM monitor system demonstrated an effective water flooding monitoring tool for a future recovery monitoring mechanism in complex reservoirs.[10]
Cross-well electromagnetic has played a critical role in mapping saturation in reservoirs and improve fluid front tracking. Additionally, it has played a crucial role in optimizing reservoir recovery via the optimization of injection strategies and the location of new wells. This by itself, plays a quintessential role in enhancing sustainability of reservoir operations via reducing the overall carbon footprint as well as minimize water consumption for reservoir recovery. While direct measurements assist, they have to be combined with novel artificial intelligence technologies in order to enhance interpretation and forecasting based on available data. As emphasized before that data is the new oil, utilization of available data in order to improve reservoir understanding will be key to enhance sustainability in operations and achieve higher productivity and prosperity.
See also
References
- ↑ Schlumberger, 2009, DeepLook-EM Enhanced crosswell reservoir monitoring system: Schlumberger.
- ↑ S. O. Glossary, 2021, Crosswell electromagnetic tomography
- ↑ J. Schön, Basic Well Logging and Formation Evaluation, 1st ed., London: Bookboon, p. 51 and 56.
- ↑ B. R. Spies and T. M. Habashy, "Sensitivity analysis of crosswell electromagnetics," Geophysics, vol. 60, no. 3, pp. 629-929.
- ↑ M. Wilt, D. L. Alumbaugh, H. F. Morrison, A. Becker, K. H. Lee and M. Deszcz-Pan, "Crosswell electromagnetic tomography: System design considerations and field results," Geophysics, vol. 60, no. 3, pp. 629-929.
- ↑ 6.0 6.1 6.2 6.3 M. Wilt, H. Morrison, A. Becker, H.-W. Tseng, K. Lee, C. Torres-Verdin and D. Alumbaugh, "Crosshole electromagnetic tomography: A new technology for oil field characterization," The Leading Edge, vol. 14, no. 3, p. 147–222.
- ↑ 7.0 7.1 M. Wilt, D. L. Alumbaugh, H. F. Morrison, A. Becker, K. H. Lee and M. Deszcz-Pan, "Crosswell electromagnetic tomography: System design considerations and field results," Geophysics, vol. 60, no. 3, pp. 629-929.
- ↑ D. V. Ellis and J. M. Singer, Well Logging for Earth Scientists, 2nd ed., Dordrecht: Springer, 2007.
- ↑ 9.0 9.1 9.2 Z. N. Bhatti, Y. J. Al Mansoori, S. M. El Sembawy, V. Vahrenkamp, N. Clerc, M. Wilt and S. L. Reeder, "Tracking Interwell Water Saturation in Pattern Flood Pilots in a Giant Gulf Oil field," in Abu Dhabi International Petroleum Exhibition and Conference, Abu Dhabi.
- ↑ 10.0 10.1 10.2 M. Al Ali, V. Vahrenkamp, S. Elsembawy, Z. Bhatti, S. L. Reeder, N. Clerc and M. Wilt, "Constraining Interwell Water Flood Imaging with Geology and Petrophysics: An Example from the Middle East," in SPE Middle East Oil & Gas Show and Conference, Manama.