Gas chromatography/mass spectrometry (GC/MS): examples of correlations
| Exploring for Oil and Gas Traps | |

| |
| Series | Treatise in Petroleum Geology |
|---|---|
| Part | Critical elements of the petroleum system |
| Chapter | Oil–oil and oil–source rock correlations |
| Author | Douglas W. Waples, Joseph A. Curiale |
| Link | Web page |
| Store | AAPG Store |
Example from the north sea

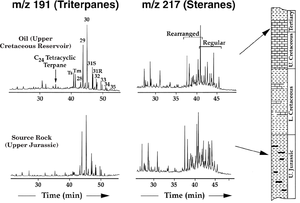
Figure 1 demonstrates a typical biomarker-based oil–source correlation from the Central Graben of the North Sea. The oil is reservoired in Upper Cretaceous rocks, whereas the source rock is from the Upper Jurassic. In this case, the sterane ratios indicate that the particular source rock sample analyzed may actually be more mature than the oil. Because of the similarity in maturities, the correlation is easier than for many less mature source rocks. The similarity in distributions of both triterpanes and steranes strongly supports a positive oil–source rock correlation in this instance.
Numbered peaks are hopanes. Ts and Tm are, respectively, 18α(H)-22,29,30-trisnorneo-hopane and 17α(H)-22,29,30-trisnorhopane. Rearranged and regular steranes are indicated.
Example from the Gulf of Mexico
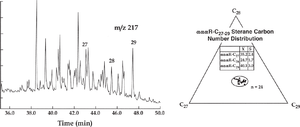
Figure 2 (left) shows the sterane distribution for a typical oil from the northern Gulf of Mexico. In this case, the distribution of 5α(H),14α(H),17α(H), 20R-cholestanes, -methylcholestanes, and -ethylcholestanes (that is, the C27, C28, and C29 regular steranes, respectively) is used as a correlation parameter because it generally remains constant throughout the thermal generation of oil. Oils from this area all have essentially identical sterane distributions (right), suggesting they are related.
Example from Oman

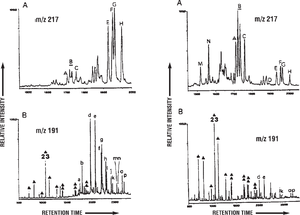
Two families of oils sourced from Precambrian rocks in Oman have been identified by Grantham.[2] Figure 3 shows the sterane and triterpane fragmentograms for representatives of the two families. Triterpane distributions look very different (bottom figures) but in fact differ mostly in the tricyclic/pentacyclic ratio. This ratio is believed to be affected by maturity as well as by source, so this difference alone does not prove the families are different. The steranes, however, are very different. One family is dominated by the C29 regular steranes (top left, peaks E, F, G, H) while the other contains almost exclusively C27 regular steranes (top right, peaks A, B, C).
Gas chromatograms (not shown) reveal the presence of a series of X-compounds in both families, diagnostic of Precambrian sources.
Sterane proportions

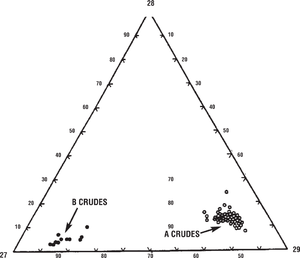
The ternary diagram in Figure 4 shows relative proportions of C27 – C29 regular steranes in numerous oils from the two families (A and B). The many oil samples analyzed are very consistent, showing clearly that two distinct families exist. Unfortunately, most correlation problems do not have such clean and neat solutions.
See also
- Molecular parameter data for oil–oil and oil–source rock correlations
- Gas chromatography: data obtained
- Gas chromatography/mass spectrometry (GC/MS): procedures
- Organic compounds: environmental indicators
- Gas chromatography/mass spectrometry (GC/MS): limitations
- High-performance liquid chromatography
References
- ↑ Telnæs, N., and B. S. Cooper, 1991, Oil-source rock correlation using biological markers, Norwegian continental shelf: Marine and Petroleum Geology, vol. 8, p. 302–310., 10., 1016/0264-8172(91)90084-E
- ↑ 2.0 2.1 2.2 Grantham, P. J., 1986, The occurrence of unusual C27 and C29 sterane predominances in two types of Oman crude oil: Organic Geochemistry, vol. 9, p. 1–10., 10., 1016/0146-6380(86)90077-X
