Fault seal analysis example: Gulf Coast
| Exploring for Oil and Gas Traps | |

| |
| Series | Treatise in Petroleum Geology |
|---|---|
| Part | Predicting the occurrence of oil and gas traps |
| Chapter | Evaluating top and fault seal |
| Author | Grant M. Skerlec |
| Link | Web page |
| Store | AAPG Store |
Routine fault seal analysis integrates both fault plane profiles and quantitative fault seal analysis. This discussion contains an example from a field in the Gulf Coast and demonstrates the application of routine fault seal analysis.
Procedure

The steps below outlines a procedure for analyzing fault seal behavior.
- Construct a fault plane profile (FPP).
- Determine seal behavior of the fault.
- Calculate the smear-gouge ratio.
- Construct a smear-gouge ratio map.
- Determine the smear-gouge ratio threshold.
Construct an FPP
Figure 1 is an FPP of a portion of a fault in a Gulf Coast field. It shows the juxtaposition of sands along the fault and the observed distribution of hydrocarbons. Sands are shown in gray (hanging wall) and orange (footwall).
Determine seal behavior

Examples of cross-leaking and cross-sealing portions of the fault are shown in Figure 2, which is a detail of Figure 1. Juxtapositions of the 7100/7100 sands and the 7200/7200 sands are cross leaking (left). These sand/sand juxtapositions have common hydrocarbon contacts across the fault. The portion of the fault juxtaposing the 7100/7200 sands, however, is cross sealing (right). Hydrocarbons in the 7200 sand in the hanging wall (Ru) are juxtaposed with water-wet sands of the 7100 sand in the footwall (Rd).
Calculate SGR and construct SGR map

SGR is calculated over the surface of the entire fault. Figure 3 is a map of the SGR contoured on the FPP of the fault in Figure 1. SGR—and seal potential—vary over the surface of the fault as the throw and stratigraphy change. Areas of high SGR are shown in red and orange. Areas of low SGR are shown in purple and blue.
The SGR is calculated by “rubber-banding” the stratigraphy in adjacent well logs to fit the stratigraphic cutoffs on the FPR The detailed log stratigraphy is necessary for reliably calculating SGR. The rubber-banding corrects for apparent thicknesses in both the well and fault plane profile.
Example: correlating SGRs, seal behavior
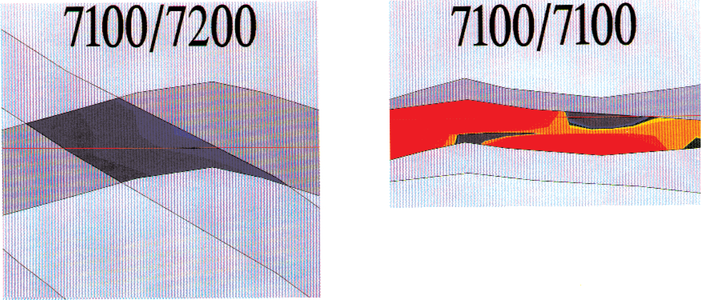
Figure 4 SGRs of two cross-leaking and cross-sealing segments of the fault.
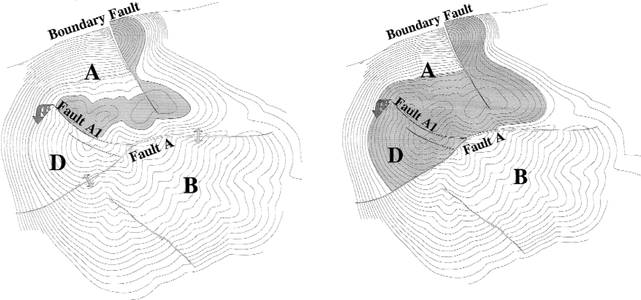
Figure 5 Faults controlling the distribution of hydrocarbons within a Gulf Coast field.


The SGR is calculated for each known sealing and leaking segment of the fault. The SGRs of two cross-leaking and cross-sealing segments of the fault are shown in Figure 4 (location is on Figure 5). SGR values along the cross-leaking sand/sand juxtapositions are high (red). Cross-leakage (right) occurs at both the 7100/7100 and 7200/7200 juxtapositions. Cross-seal (left) occurs where the 7100 sand is juxtaposed with the 7200 sand. This cross-sealing segment is characterized by low SGRs (blue). Cross-leakage occurs where the SGR is high; cross-seal occurs where it is low.
Calibrating SGR threshold
This same iterative process is used to construct SGR threshold plots and to calibrate the critical SGR necessary for seal and leak. The SGR threshold plot of the Gulf Coast noted earlier in this subsection was constructed from a similar analysis of 160 known sealing and leaking fault segments. The constantly expanding database now includes 246 faults in the Gulf Coast. The result is the ability to risk fault seal behavior with a high degree of confidence. Fewer than 10% of the faults analyzed in the Gulf Coast are exceptions to this pattern.
See also
- Quantitative fault seal analysis
- How fault zones affect seal
- Quantitative fault seal analysis
- Limitations of quantitative fault seal analysis
External links
| find literature about Fault seal analysis example: Gulf Coast |