Gas chromatography/mass spectrometry (GC/MS): limitations
| Exploring for Oil and Gas Traps | |

| |
| Series | Treatise in Petroleum Geology |
|---|---|
| Part | Critical elements of the petroleum system |
| Chapter | Oil–oil and oil–source rock correlations |
| Author | Douglas W. Waples, Joseph A. Curiale |
| Link | Web page |
| Store | AAPG Store |
Effects of maturation and migration
Sterane and triterpane concentrations decrease greatly during oil cracking. Therefore, thermal condensates (light oils) do not normally contain large amounts of steranes and triterpanes. Consequently, steranes and triterpanes are usually of little value in high-maturity oils and condensates. Furthermore, some condensates that do contain steranes and triterpanes may have picked up all or most of them during migration by extraction from the rocks through which they passed (see Waples and Machihara[1] for examples and references). Finally, because triterpane and particularly sterane distributions change greatly during maturation, correlations of those biomarkers between an immature source rock and an oil can be very difficult. In such cases a strictly numerical approach, working with peak ratios and relative proportions, can be better than a visual one, since the eye can be unduly influenced by maturity-related differences instead of genetic characteristics.
Biodegradation and sterane distributions

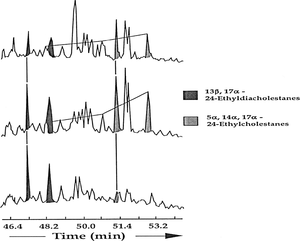
Biodegradation, where severe, can also cause major changes in sterane and triterpane distributions. The ααα-20R steranes (regular steranes with the 20R configuration) are lost selectively during the early stages of severe biodegradation, followed by loss of all ααα steranes. Figure 1 illustrates this trend. It shows the m/z 217.2 mass chromatograms of three oils from central Myanmar in successive stages of biodegradation, ranging from not degraded (top) to extremely degraded (bottom). The severely degraded oil has lost almost all of its regular steranes, with greater loss of 20R than 20S. Gas chromatograms of these three oils are shown in Figure 8-20.
Biodegradation and hopane distribution

Although hopane distributions are well known to change during extreme biodegradation, the causes for these changes are controversial and poorly understood. At very high levels of biodegradation, hopanes and moretanes disappear. In their place appear series of demethylated hopanes and moretanes (25-norhopanes and 25-normoretanes). Although workers originally believed the regular hopanes and moretanes were converted to their demethylated forms by bacterial removal of a single methyl group, that explanation has been disputed. Some workers today believe that the hopanes and moretanes simply disappear, and their disappearance merely reveals pre-existing series of less abundant demethylated species that could not be seen in the presence of regular hopanes and moretanes.
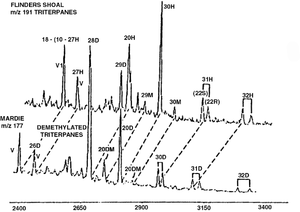
Figure 2 shows an example of the regular hopane and moretane series in a nondegraded oil (top), as shown in the m/z 191 mass chromatogram, compared to the series of demethylated hopanes and moretanes in a heavily biodegraded oil (bottom), revealed in the m/z 177 mass chromatogram.
Another hopane distribution example
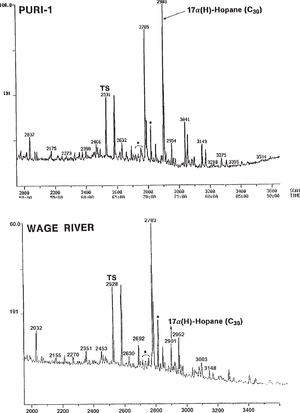
Figure 3, which shows m/z 191 mass chromatograms of two genetically related oils from Papua New Guinea, gives another example of a major difference in hopane distribution. This difference could erroneously be considered genetic but is actually an unusual result of severe biodegradation. The top oil, recovered from a drill-stem test and not biodegraded, contains a full suite of triterpanes. The bottom seep oil, in contrast, is heavily biodegraded (gravity 30 hopane and homohopanes. The C29 hopane is either unaffected or only slightly reduced in concentration. Tm, Ts, moretanes, and Cz (indicated with *) also appear unaffected at this level of biodegradation.
Internal standards
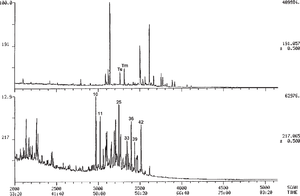
Internal standards can appear in GC/MS data as well as in gas chromatograms. Figure 4 shows m/z 191 (top) and 217 (bottom) mass chromatograms for a seep oil from Papua New Guinea. The three peaks in the top chromatogram to the left of Ts come from the internal standard, which was supposed to be a single compound but is actually a mixture (probably of various isomers of the same compound). The internal standard was unlabelled on this mass chromatogram and, as such, poses a serious risk even for experienced interpreters since the internal standard peaks might be thought to represent indigenous compounds.
For additional information
Additional technical information on GC/MS techniques is available in Waples and Machihara[1] and Peters and Moldowan.[4]
See also
- Molecular parameter data for oil–oil and oil–source rock correlations
- Gas chromatography: data obtained
- Gas chromatography/mass spectrometry (GC/MS): procedures
- Organic compounds: environmental indicators
- Gas chromatography/mass spectrometry (GC/MS): examples of correlations
- High-performance liquid chromatography
References
- ↑ 1.0 1.1 Waples, D. W., and T. Machihara, 1991, Biomarkers for geologists: Tulsa, AAPG, 91 p.
- ↑ Curiale, J. A., 1994, Correlation of oils and source rocks—a conceptual and historical perspective, in L. B. Magoon, and W. G. Dow, eds., The Petroleum system—From Source to Trap: AAPG Memoir 60, p. 251–260.
- ↑ Volkman, J. K., R. Alexander, R. I. Kagi, G. W. Woodhouse, 1983, Demethylated hopanes in crude oils and their applications in petroleum geochemistry: Geochimica et Cosmochimica Acta, vol. 47, p. 785–794, DOI: 10.1016/0016-7037(83)90112-6.
- ↑ Peters, K. E., and J. M. Moldowan, 1993, The Biomarker Guide—Interpreting Molecular fossils in Petroleum and Ancient Sediments: Englewood Cliffs, New Jersey, Prentice-Hall, 363 p.

