Vitrinite reflectance
| Exploring for Oil and Gas Traps | |

| |
| Series | Treatise in Petroleum Geology |
|---|---|
| Part | Critical elements of the petroleum system |
| Chapter | Evaluating source rocks |
| Author | Carol A. Law |
| Link | Web page |
| Store | AAPG Store |
Vitrinite reflectance is a measure of the percentage of incident light reflected from the surface of vitrinite particles in a sedimentary rock. It is referred to as %Ro. Results are often presented as a mean Ro value based on all vitrinite particles measured in an individual sample.
Connection between vitrinite and kerogen
The maturation of vitrinite is a kinetic process. The relationship between %Ro and hydrocarbon generation is dependent on the chemistry of the vitrinite as well as the chemistry of the kerogen.
Oil and gas zones

Oil and gas zone boundaries can be established using vitrinite reflectance data. The boundaries are approximate and vary according to kerogen type. Figure 1 shows the approximate boundaries for kerogen types I, II, and III. Time-temperature relationships and mixing of various sources of organic matter may alter these boundaries.
Misleading data, cautions, and recommendations

Abimodal distribution or a large spread in the range of measured values produces a mean Ro value that does not accurately represent the maturity of the rock sample. Variations or errors in vitrinite reflectance measurements may be caused by the following:
- vitrinite composition
- Incorrect identification of vitrinite particles
- Anisotropy
- Oxidation
- Staining
- Presence of caved vitrinite particles in borehole cuttings
- Reworking of vitrinite in the geologic section
- Drilling mud additives
Therefore, explorationists should always request and examine the raw data as well as the histograms and mean data.
Figure 2 is a perfect example from a sample where the mean value reported is 1.27% Ro, based on 14 measurements. The interpretation of the mean value would place this sample past the oil generation zone. The true reflectance of the indigenous vitrinite in this sample is 0.7% Ro, providing an extremely different interpretation and placing the sample in the early stage of liquid hydrocarbon generation.
A bimodal distribution or a large spread in the range of measured values will produce a mean Ro that does not truly represent the maturity of a rock sample.
Recognizing good data
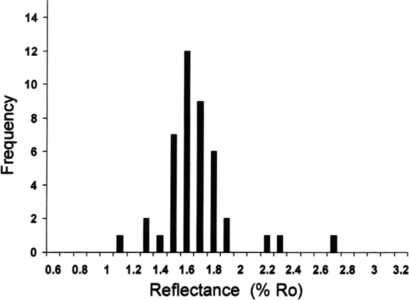
Figure 3 Histogram with a single mode in the distribution curve tightly clustered about a mean value.
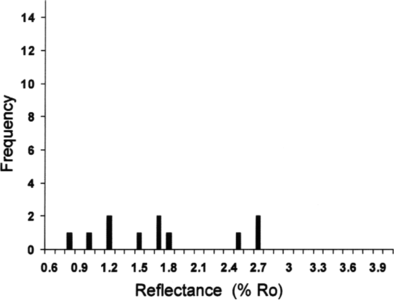
Figure 4 Example of a poor profile due to a lack of data.
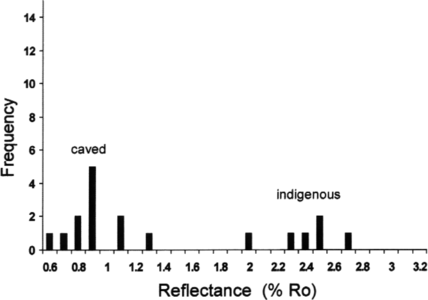
Figure 5 Histogram representing poor-quality vitrinite reflectance data due to contamination by caving.
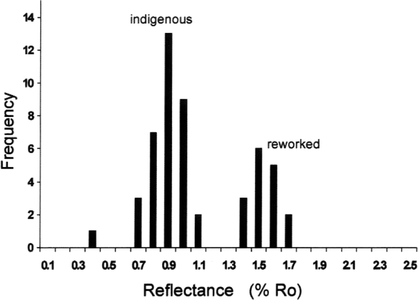
Figure 6 Bimodal distribution.


An excellent way to recognize high-quality vitrinite reflectance data is to plot it in a histogram. We can have high confidence in the data when a single mode in the distribution curve is tightly clustered about a mean value. The histogram in Figure 3 is a good example.
Adequate number of measurements
A histogram profile of vitrinite reflectance used to estimate the maturity level of a sample must have an adequate number of measurements. Make as many reflectance measurements as possible for a valid Ro determination for a sample. The histogram in Figure 4 is an example of a poor profile due to a lack of data. We should not place a high degree of confidence in an Ro obtained from this sample. A rule of thumb is 40-50 vitrinite readings per sample.
Data contaminated by caving
The histogram in Figure 5 represents poor-quality vitrinite reflectance data due to contamination by caving. As a result of the drilling process, immature kerogen caved into the bore-hole and mixed with drill cuttings originally containing sparse amounts of vitrinite. The indigenous vitrinite is about 2.5% Ro. Therefore, it is important to know the type of sample used for vitrinite analysis.
Sample with reworked vitrinite
The bimodal distribution shown in the histogram in Figure 6 represents an indigenous and a reworked population of vitrinite measured in one sample. The reworked population would have been eroded from a more mature provenance and deposited with the indigenous organic matter of this sample.
See also
- Evaluating source rock maturity
- Maturation
- Tmax
- Apatite fission track analysis
- Spore coloration and thermal alteration indices
- Hydrogen Index (HI)
- Production Index (PI)
References
- ↑ Tissot, B. P., and D.H. Welte, 1984, Petroleum Formation and Occurrence, 2 ed.: New York, Springer-Verlag, 699 p.
External links
| find literature about Vitrinite reflectance |