Difference between revisions of "Kerogen type and hydrocarbon generation"
Cwhitehurst (talk | contribs) m (added Category:Treatise Handbook 3 using HotCat) |
|||
| (20 intermediate revisions by 3 users not shown) | |||
| Line 6: | Line 6: | ||
| part = Critical elements of the petroleum system | | part = Critical elements of the petroleum system | ||
| chapter = Evaluating source rocks | | chapter = Evaluating source rocks | ||
| − | | frompg = 6- | + | | frompg = 6-34 |
| − | | topg = 6- | + | | topg = 6-35 |
| author = Carol A. Law | | author = Carol A. Law | ||
| link = http://archives.datapages.com/data/specpubs/beaumont/ch06/ch06.htm | | link = http://archives.datapages.com/data/specpubs/beaumont/ch06/ch06.htm | ||
| Line 14: | Line 14: | ||
| isbn = 0-89181-602-X | | isbn = 0-89181-602-X | ||
}} | }} | ||
| − | + | ==Arrhenius equation== | |
| − | :<math>\ | + | [[Kerogen]] consists of many fractions, each converting to hydrocarbons at a specified rate. This rate of conversion to hydrocarbons is defined by a first-order rate equation known as the Arrhenius equation: |
| + | |||
| + | :<math>\text{K} = \mbox{Ae}^{-{\text{E}_\text{a}/\text{RT(t)}}}</math> | ||
where: | where: | ||
| − | * A = | + | * A = pre-exponent factor |
| − | * E = activation energy | + | * E<sub>a</sub> = [[activation energy]] |
| + | * T = absolute temperature (in kelvin) | ||
| + | * R = universal gas constant | ||
| + | * t = time | ||
These are generally referred to as '''kinetic parameters'''. They can be measured using various pyrolysis techniques and are different for each distinct kerogen analyzed. | These are generally referred to as '''kinetic parameters'''. They can be measured using various pyrolysis techniques and are different for each distinct kerogen analyzed. | ||
| − | + | ==Hydrocarbon generation—depth and yield== | |
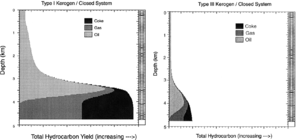
| − | + | [[file:evaluating-source-rocks_fig6-15.png|thumb|300px|{{figure number|1}}.Hydrocarbon generation vs. depth plots for types I (left) and III (right) kerogens) based on identical burial and thermal conditions. From results of Genex 1-D basin modeling software, courtesy Institute Français du Petrole.]] | |
| − | |||
| − | The | + | The depth of [[Petroleum generation|hydrocarbon generation]] and the yield of individual [[hydrocarbon]] phases are primarily a function of the [[kinetics]] of the kerogen-hydrocarbon conversion. Burial history and catalytic effects, due to [[source rock]] matrix chemistry, affect the rate of generation, although these effects are secondary to the kinetic effects. |
| − | [[file:evaluating-source-rocks_fig6- | + | [[:file:evaluating-source-rocks_fig6-15.png|Figure 1]] shows hydrocarbon generation vs. depth plots for types I (left) and III (right) kerogens are based on identical burial and thermal conditions. Thus, they depict the difference in the depth of hydrocarbon generation, based on [[Kerogen types|kerogen type]] alone. Type I kerogen generally has a shallower liquid hydrocarbon zone and generates significantly larger amounts of hydrocarbons. The onset of generation is indicated by the change in the slope of the curves. |
==Timing hydrocarbon generation== | ==Timing hydrocarbon generation== | ||
| − | Variations in the kinetic parameters affect predictions of the present-day distribution of hydrocarbon generation zones and also influence when, in geologic time, a potential source interval | + | |
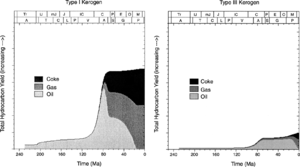
| + | [[file:evaluating-source-rocks_fig6-16.png|thumb|300px|{{figure number|2}}Comparison of the timing of hydrocarbon generation from type I kerogen (left) to type III (right).]] | ||
| + | |||
| + | Variations in the kinetic parameters affect predictions of the present-day distribution of hydrocarbon generation zones and also influence when, in geologic time, a potential [[source]] interval generated hydrocarbons. [[:file:evaluating-source-rocks_fig6-16.png|Figure 2]] compares the timing of hydrocarbon generation from type I kerogen (left) to type III (right). The onset of hydrocarbon generation is indicated by the dramatic change in slope of the curves: 110-100 Ma for type I and 90-80 Ma for type III. The difference in timing shown in this example is based only on the different kinetic parameters of the kerogen types. | ||
==Recommendations== | ==Recommendations== | ||
| − | Conduct kerogen kinetic analysis on samples from the basin being modeled. If samples are not available, standard values for types I–III are available from<ref name=ch06r1>Burnham, A. | + | Conduct kerogen kinetic analysis on samples from the basin being modeled. If samples are not available, standard values for types I–III are available from<ref name=ch06r1>Burnham, A. K., 1989, A Simple Model of Petroleum Formation and Cracking: Lawrence Livermore Laboratory report UCID 21665, March 1989.</ref><ref name=ch06r2>Burnham, A. K., and J. J. Sweeney, 1990, Modeling Maturation and Migration of Petroleum: Lawrence Livermore Laboratory report UCRL 102602, rev. 1.</ref><ref name=ch06r11>Tissot, B. P., and J. Espitalie, 1975, L'evolution thermique de la matiere organique des sediments: aplications d'une simulation mathematique: Rev. IFP, vol. 30, p. 743–777, DOI: 10.2516/ogst:1975026</ref>. Apply these values after carefully classifying the kerogen type in terms of the [[Depositional environments|depositional environment]] of the individual source intervals. |
==See also== | ==See also== | ||
| Line 44: | Line 51: | ||
* [[Kerogen type and maturity]] | * [[Kerogen type and maturity]] | ||
* [[Kerogen type and transformation ratio]] | * [[Kerogen type and transformation ratio]] | ||
| − | * [[ | + | * [[Kerogen types: comparison of maturity measures]] |
* [[Open- vs closed-system generation modeling]] | * [[Open- vs closed-system generation modeling]] | ||
| Line 57: | Line 64: | ||
[[Category:Critical elements of the petroleum system]] | [[Category:Critical elements of the petroleum system]] | ||
[[Category:Evaluating source rocks]] | [[Category:Evaluating source rocks]] | ||
| + | [[Category:Treatise Handbook 3]] | ||
Latest revision as of 16:11, 10 February 2022
| Exploring for Oil and Gas Traps | |

| |
| Series | Treatise in Petroleum Geology |
|---|---|
| Part | Critical elements of the petroleum system |
| Chapter | Evaluating source rocks |
| Author | Carol A. Law |
| Link | Web page |
| Store | AAPG Store |
Arrhenius equation
Kerogen consists of many fractions, each converting to hydrocarbons at a specified rate. This rate of conversion to hydrocarbons is defined by a first-order rate equation known as the Arrhenius equation:
where:
- A = pre-exponent factor
- Ea = activation energy
- T = absolute temperature (in kelvin)
- R = universal gas constant
- t = time
These are generally referred to as kinetic parameters. They can be measured using various pyrolysis techniques and are different for each distinct kerogen analyzed.
Hydrocarbon generation—depth and yield
The depth of hydrocarbon generation and the yield of individual hydrocarbon phases are primarily a function of the kinetics of the kerogen-hydrocarbon conversion. Burial history and catalytic effects, due to source rock matrix chemistry, affect the rate of generation, although these effects are secondary to the kinetic effects.
Figure 1 shows hydrocarbon generation vs. depth plots for types I (left) and III (right) kerogens are based on identical burial and thermal conditions. Thus, they depict the difference in the depth of hydrocarbon generation, based on kerogen type alone. Type I kerogen generally has a shallower liquid hydrocarbon zone and generates significantly larger amounts of hydrocarbons. The onset of generation is indicated by the change in the slope of the curves.
Timing hydrocarbon generation
Variations in the kinetic parameters affect predictions of the present-day distribution of hydrocarbon generation zones and also influence when, in geologic time, a potential source interval generated hydrocarbons. Figure 2 compares the timing of hydrocarbon generation from type I kerogen (left) to type III (right). The onset of hydrocarbon generation is indicated by the dramatic change in slope of the curves: 110-100 Ma for type I and 90-80 Ma for type III. The difference in timing shown in this example is based only on the different kinetic parameters of the kerogen types.
Recommendations
Conduct kerogen kinetic analysis on samples from the basin being modeled. If samples are not available, standard values for types I–III are available from[1][2][3]. Apply these values after carefully classifying the kerogen type in terms of the depositional environment of the individual source intervals.
See also
- Relationships between maturity and hydrocarbon generation
- Kerogen type and maturity
- Kerogen type and transformation ratio
- Kerogen types: comparison of maturity measures
- Open- vs closed-system generation modeling
References
- ↑ Burnham, A. K., 1989, A Simple Model of Petroleum Formation and Cracking: Lawrence Livermore Laboratory report UCID 21665, March 1989.
- ↑ Burnham, A. K., and J. J. Sweeney, 1990, Modeling Maturation and Migration of Petroleum: Lawrence Livermore Laboratory report UCRL 102602, rev. 1.
- ↑ Tissot, B. P., and J. Espitalie, 1975, L'evolution thermique de la matiere organique des sediments: aplications d'une simulation mathematique: Rev. IFP, vol. 30, p. 743–777, DOI: 10.2516/ogst:1975026


