Kerogen type and maturity
| Exploring for Oil and Gas Traps | |

| |
| Series | Treatise in Petroleum Geology |
|---|---|
| Part | Critical elements of the petroleum system |
| Chapter | Evaluating source rocks |
| Author | Carol A. Law |
| Link | Web page |
| Store | AAPG Store |
Each kerogen type has its own relationship to maturity parameters. Maturity measurements are made on materials other than kerogen; therefore, they are not a direct measure of the hydrocarbon generation stage of the source intervals. A relationship must be established between maturity of the geologic section and hydrocarbon generation for each kerogen type in a basin. This relationship can be derived using 1-D basin modeling techniques.
Hydrocarbon generation and maturity
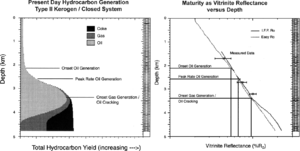
The hydrocarbon generation-depth curve in Figure 1 indicates where various phases of hydrocarbons would be generated today in the geologic section if a uniform kerogen existed throughout. We would use the following steps to compare the relationships.
- Define the hydrocarbon generation stage for a calibrated well based on the depth vs. hydrocarbon yield plot (left figure). For example, the onset of oil generation occurs at approximately length::2.1 km. Then transfer to the depth versus maturity plot (in this case vitrinite reflectance, right figure) and follow across at length::2.1 km until you reach the maturity profile. This vitrinite reflectance value (0.55 %Ro ) would indicate the onset of hydrocarbon generation in this well.
- Apply this relationship to predict the generation zones for this specific kerogen in wells with similar thermal and burial histories in the basin for which maturity data are available.
Comparison and maturity measures
The table below shows examples of the relationships between hydrocarbon generation zones, maturity, and transformation ratio for standard types II and III kerogens, based on a specific burial and thermal history model. The most significant difference is in the depth to the onset of oil generation, where depth::1000 m separates the top of the oil windows of these two kerogen types.
| Hydrocarbon generation zone | Vitrinite refl., % Ro, Type II | Vitrinite refl., % Ro, Type III | Transformation ratio, %, Type II | Transformation ratio, %, Type III | Present-day depth, m, Type II | Present-day depth, m, Type III |
|---|---|---|---|---|---|---|
| Onset oil | 0.55 | 0.85 | 5 | 12 | 2200 | 3200 |
| Onset peak rate generation | 0.65 | 1.00 | 17 | 31 | 2600 | 3500 |
| Onset gas/cracking liquids | 0.95 | 1.35 | 88 | 64 | 3400 | 4050 |
See also
- Relationships between maturity and hydrocarbon generation
- Kerogen type and hydrocarbon generation
- Kerogen type and transformation ratio
- Kerogen types: comparison of maturity measures
- Open- vs closed-system generation modeling
