Difference between revisions of "East Breaks depositional sequence"
Cwhitehurst (talk | contribs) |
Cwhitehurst (talk | contribs) |
||
| Line 18: | Line 18: | ||
This article discusses the concept of depositional sequences and how to identify them, using a data set from the High Island–East Breaks area. The location of this study area is shown on the depocenter maps of Figures [[:File:Sedimentary-basin-analysis_fig4-13.png|1]] through [[:file:Sedimentary-basin-analysis_fig4-13.png|4]]. | This article discusses the concept of depositional sequences and how to identify them, using a data set from the High Island–East Breaks area. The location of this study area is shown on the depocenter maps of Figures [[:File:Sedimentary-basin-analysis_fig4-13.png|1]] through [[:file:Sedimentary-basin-analysis_fig4-13.png|4]]. | ||
| − | <gallery mode=packed heights= | + | <gallery mode=packed heights=200px widths=200px> |
| − | File:Sedimentary-basin-analysis_fig4-13.png|{{figure number|1}} | + | File:Sedimentary-basin-analysis_fig4-13.png|{{figure number|1}}Paleogeography of the Mississippi River depositional system from approximately 6 Ma to 4 Ma. After Piggott and Pulham;<ref name=P&P1993>Piggott, N., and A. Pulham, 1993, Sedimentation rate as the control on hydrocarbon sourcing, generation, and migration in the deepwater Gulf of Mexico: Proceedings, Gulf Coast Section SEPM 14th Annual Research Conference, p. 179–191.</ref> courtesy Gulf Coast Section SEPM. |
| − | File:Sedimentary-basin-analysis_fig4-14.png|{{figure number|2}} | + | File:Sedimentary-basin-analysis_fig4-14.png|{{figure number|2}}Paleogeography from approximately 4 Ma to 3 Ma. After Piggott and Pulham;<ref name=P&P1993 /> courtesy Gulf Coast Section SEPM. |
| − | File:Sedimentary-basin-analysis_fig4-15.png|{{figure number|3}} | + | File:Sedimentary-basin-analysis_fig4-15.png|{{figure number|3}}Paleogeography from approximately 2.5 Ma to 2 Ma. After Piggott and Pulham;<ref name=P&P1993 />; courtesy Gulf Coast Section SEPM. |
| − | File:Sedimentary-basin-analysis_fig4-16.png|{{figure number|4}} | + | File:Sedimentary-basin-analysis_fig4-16.png|{{figure number|4}}Paleogeographic map representing time from about 1 Ma to the present. After Piggott and Pulham;<ref name=P&P1993 /> courtesy Gulf Coast Section SEPM. Also after Weimer;<ref>Weimer, P., 1990, [http://archives.datapages.com/data/bulletns/1990-91/data/pg/0074/0004/0000/0425.htm Sequence stratigraphy, facies geometries, and depositional history of the Mississippi fan, Gulf of Mexico]: AAPG Bulletin, vol. 74, p. 425–453.</ref> courtesy AAPG. |
| − | File:Sedimentary-basin-analysis_fig4-17.png|{{figure number|5}} | + | File:Sedimentary-basin-analysis_fig4-17.png|{{figure number|5}}Map of the study area, showing the named offshore exploration areas and bathymetry. |
</gallery> | </gallery> | ||
| Line 36: | Line 36: | ||
* [[Recognizing stacked depositional sequences in seismic profiles]] | * [[Recognizing stacked depositional sequences in seismic profiles]] | ||
* [[Recognizing stacked depositional sequences from well data]] | * [[Recognizing stacked depositional sequences from well data]] | ||
| + | |||
| + | ==References== | ||
| + | {{reflist}} | ||
==External links== | ==External links== | ||
Revision as of 20:37, 15 October 2014
| Exploring for Oil and Gas Traps | |

| |
| Series | Treatise in Petroleum Geology |
|---|---|
| Part | Critical elements of the petroleum system |
| Chapter | Sedimentary basin analysis |
| Author | John M. Armentrout |
| Link | Web page |
| Store | AAPG Store |
Each depocenter has a unique depositional history that reflects the integration of all responses to depositional processes and environmental factors, including tectonics, climate, sediment supply, and sea level variation. These factors result in cycles of deposition: the sediments accumulated during each cycle are the depositional sequence. Integration of multiple data sets, including (1) seismic reflection profiles, (2) biostratigraphic analyses, (3) wireline logs, (4) cores, and (5) detailed measured sections, helps us define the depositional sequences and interpret primary factors affecting formation of each cycle. Precise mapping of each depositional sequence within each depocenter requires careful data integration.
This article discusses the concept of depositional sequences and how to identify them, using a data set from the High Island–East Breaks area. The location of this study area is shown on the depocenter maps of Figures 1 through 4.
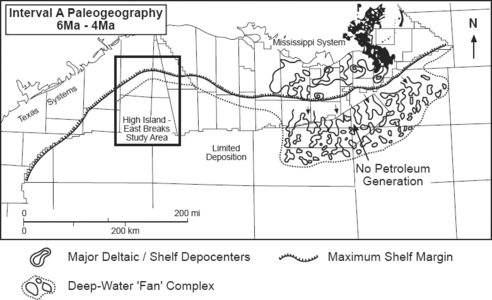
Figure 1 Paleogeography of the Mississippi River depositional system from approximately 6 Ma to 4 Ma. After Piggott and Pulham;[1] courtesy Gulf Coast Section SEPM.
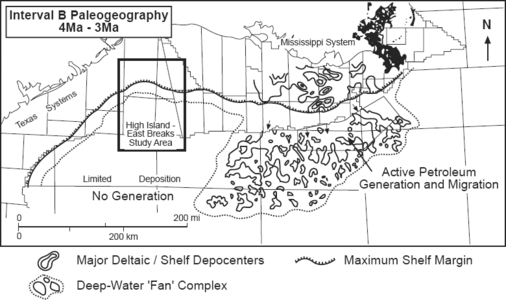
Figure 2 Paleogeography from approximately 4 Ma to 3 Ma. After Piggott and Pulham;[1] courtesy Gulf Coast Section SEPM.
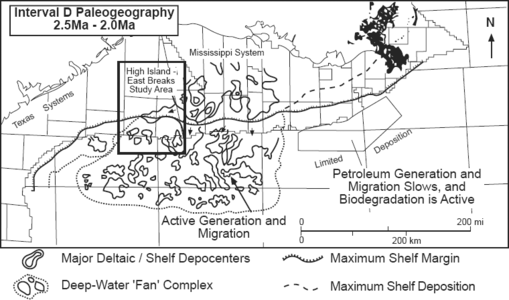
Figure 3 Paleogeography from approximately 2.5 Ma to 2 Ma. After Piggott and Pulham;[1]; courtesy Gulf Coast Section SEPM.
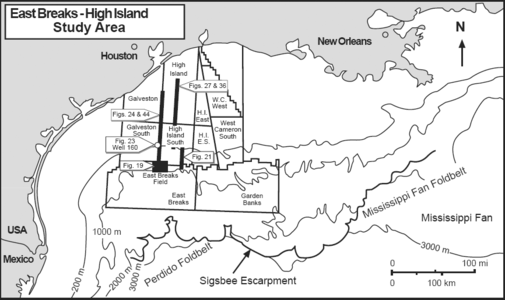
Figure 5 Map of the study area, showing the named offshore exploration areas and bathymetry.


Examples in this section
Figure 5 is a map of the study area, showing the named offshore exploration areas and bathymetry. It also shows the locations of the East Breaks 160-161 field, illustrated seismic profiles and a reference well.
See also
- Definitions of depositional system elements
- Identifying depositional sequences
- Identifying depositional sequences in seismic sections
- Identifying depositional sequences from biostratigraphic data
- Recognizing stacked depositional sequences in seismic profiles
- Recognizing stacked depositional sequences from well data
References
- ↑ 1.0 1.1 1.2 1.3 Piggott, N., and A. Pulham, 1993, Sedimentation rate as the control on hydrocarbon sourcing, generation, and migration in the deepwater Gulf of Mexico: Proceedings, Gulf Coast Section SEPM 14th Annual Research Conference, p. 179–191.
- ↑ Weimer, P., 1990, Sequence stratigraphy, facies geometries, and depositional history of the Mississippi fan, Gulf of Mexico: AAPG Bulletin, vol. 74, p. 425–453.
External links
| find literature about East Breaks depositional sequence |