Hydrodynamic traps: mapping
| Exploring for Oil and Gas Traps | |

| |
| Series | Treatise in Petroleum Geology |
|---|---|
| Part | Critical elements of the petroleum system |
| Chapter | Formation fluid pressure and its application |
| Author | Edward A. Beaumont, Forrest Fiedler |
| Link | Web page |
| Store | AAPG Store |
Mapping hydrodynamic traps
Formation fluid pressure data are necessary for mapping prospective hydrodynamic traps. Combining formation fluid pressures with other data, such as density and subsea elevation, produces maps that help outline areas where hydrodynamic gradients may have created, destroyed, or modified traps.
Procedure: mapping hydrodynamic traps
Follow the steps listed in the table below to map the location of possible hydrodynamic traps.
- Look for permeability barriers or hydrocarbon-free water levels using pressure-depth plots.
- Calculate potentiometric values for each well using the formula
- Make a water isopotential map with respect to oil or gas, using the formula for V,
- Note: Use gas density where gas is expected and oil density where oil is expected.
- Make a gas or oil isopotential contour map using the formula for U where U = V – Z. The values for Z, the subsea elevation of the target aquifer, can be determined by simply overlaying a structure contour map on the water isopotential map and subtracting (see “Example” below).
- Locate possible accumulations of hydrocarbons in hydrodynamic traps by locating the areas of low gas or oil potential. Locations should make sense in context with all other geologic data.
Calculating hw
A critical step in mapping hydrodynamic traps in a target formation is making a water isopotential map (step 3 above). Before that can be done, however, one must calculate a potentiometric value for each well.
Calculate Hw for each well using the formula
where:
- Z = structural elevation of target formation
- P = measured fluid pressure in the formation
- grad P = static formation water pressure gradient
For grad P, use 0.435 psi/ft for areas where regional water is probably fresh and 0.465 psi/ft for areas where regional water is probably highly saline.
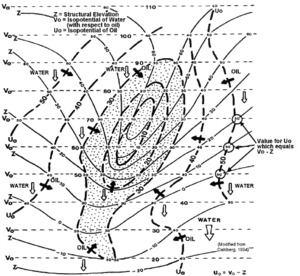
Example: u0 contours

The map in Figure 1 shows oil in a hydrodynamic trap (shaded area). No oil could be trapped in the structure, represented by solid contours, without the aid of hydrodynamics. The bold contours with long dashes represent the isopotential of oil (labeled U0). To make Uo contours, follow this procedure.
- Subtract the structure of the target formation (Z) from the isopotential of water (Vo ).
- Plot the remainder at the intersection of the two sets of contours.
- Draw contours of the values.
See also
References
- ↑ Dahlberg, E. C., 1994, Applied Hydrodynamics in Petroleum Exploration, 2nd ed.: New York, Springer-Verlag, 295 p


