Cross-well electromagnetic tomography monitoring of fluid distribution
An Entry from the AAPG 2021 Middle East Wiki Write Off!
by Sara Abu Alsaud and Klemens Katterbauer, Saudi Aramco
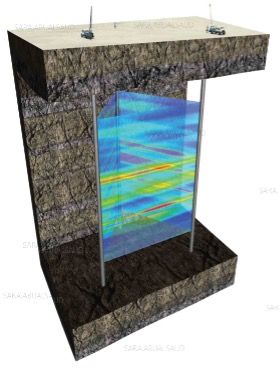
Cross-well electromagnetic (EM) tomography is a cross-sectional electrical imaging method used to evaluate the fluid distribution between two or more wells in the formation (Figure 1). The main objective of using this technology is to distinguish between different types of rock pore fluids by using the fluid conductivity analogy as a determining factor. Knowing the fluid content and distribution is essential in calculating the original hydrocarbon in place, in which the fluid conductivity is determined by the type of fluid present, whether it is water, oil, or gas. Afterward, the water saturation is empirically determined from the measured water resistivity. Unlike the traditional resistivity logging tools, the cross-well EM tomography measures the resistivity distance away from the borehole passing areas close to the invaded zone. This capability is essential when surveying fields that have been in production for an extended period of time. This technology plays a critical role in monitoring the fluid movement between the wells.
Cross-well EM tomography have many usages and applications, but it is mainly used in:
- Bypassed hydrocarbon identifications.
- Reservoir surveillance.
- Sweep efficiency monitoring.
- Reservoir simulations improvements.
- Reservoir heterogeneity mapping.
- Infill drilling planning and production optimizations.
- Thermal enhanced oil recovery monitoring.
Theory
Cross-well EM devices are an extension of the resistivity logging tools. These tools measure the conductivity of the formation, where its reciprocals give the resistivity. The measurements are presented by a resistivity log, which is a plot of resistivity versus depth. The resistivity log reflects the nature of hydrocarbon presence in the penetrated formation. The basis behind the measurements is the conductivity and insulation concepts. Conductive materials pass electrical current easily compared to insulators. In the formation, water is an electrolyte. An electrolyte is an electrically conducting solution that contains dissolved cations and anions. These ions help pass electrical currents through the formation. In contrast, completely dry rocks are insulators, which give incredibly large resistivity.
Resistivity devices are divided into two primary types, electrode (galvanic) devices, and induction devices. Electrode devices measure the electrical potential (voltage) of the passing electrical current. For the measurement to take place, the electrodes should be within a water-based mud, specifically salty water. The induction devices use an alternating current to generate an alternating primary magnetic field that induces a current into the formation. Then, the induced current generates a secondary magnetic field that is measured by the coils. The induction device's advantage over the electrode devices is that it is used in an oil-based mud or a relatively low conductive mud, like freshwater-based mud [1, p. 51 & 56].
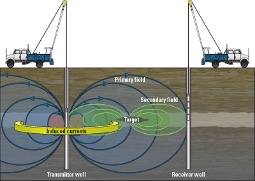
The cross-well EM system falls under the induction devices, but instead of having the transmitter and receiver in a single logging tool, the transmitter and receiver are two isolated entities, in which the transmitter is in one well, and the receiver is in another. The magnetic fields and induction currents visuals are demonstrated in Figure 2.
Theoretical Design of a Cross-well EM system
Waves propagation into the formation depends on the amount of frequency used, since the reservoir is further away from the borehole, a high wave frequency, in the MHz, can only give information near the borehole. Therefore, a lower frequency system is used due to its high wavelength, which ultimately results in a higher depth of investigation. The wave propagation concept is applied together with the diffusion equation to design the EM system.
The EM regions between the source and receiver shaped like a quasi-ellipse. The primary EM fields are considered to be uniformed and are donated as the background conductivity of the medium (σ_b). The source receiver sensitivity between the wells are measured by perturbing a small volume or a point in the quasi ellipse region. This perturbation results in having a non-uniform secondary EM field. As a result, the disturbed secondary field is calculated by using the Fréchet derivative [2] [3]. The result of the Fréchet derivative is displayed in equation (1), which represent the magnetic field sensitivity.
Equation (1) KHz = σb Ghz Eϕb
The receiver magnetic flux density is obtained by the following equation:
Equation (2) Hz = (-M)/(4πr^3 ) e(-ikb r) (1+ikb r-kb2 r2 )
Equation (3) kb2=ω2 με + iσb ωμ
The first term in equation (3) is negligible due to its small contribution k_b. By using both equations (2) and (3), the minimum transmitter dipole moment can be calculated.
| Symbol | Definition | Unit | SI Base Unit |
|---|---|---|---|
| KHz | Magnetic field sensitivity function | - | - |
| Eϕb | Tangential electric field | Volts per meter (V/m) | m.kg s-3 A-1 |
| σb | Background conductivity | Siemens per meter (S/m) | kg-1.m-3 A-1 |
| Ghz | Greens function magnetic field | - | - |
| Hz | Magnetic flux density in the z-direction | Tesla (T) | kg.s-2.A-1 |
See also


