Structural exploration: thrust belt example
| Exploring for Oil and Gas Traps | |

| |
| Series | Treatise in Petroleum Geology |
|---|---|
| Part | Predicting the occurrence of oil and gas traps |
| Chapter | Exploring for structural traps |
| Author | R.A. Nelson, T.L. Patton, S. Serra |
| Link | Web page |
| Store | AAPG Store |
This example of structural exploration in the Laramide western Wyoming thrust belt in the late 1970s and early 1980s illustrates how the preceding tasks flow together and applies the techniques and approaches in Figure 1. The exploration process begins with an examination of the regional tectonic setting of the Wyoming thrust belt and gradually narrows to a study of structural features at the prospect level.
Tectonic setting[edit]
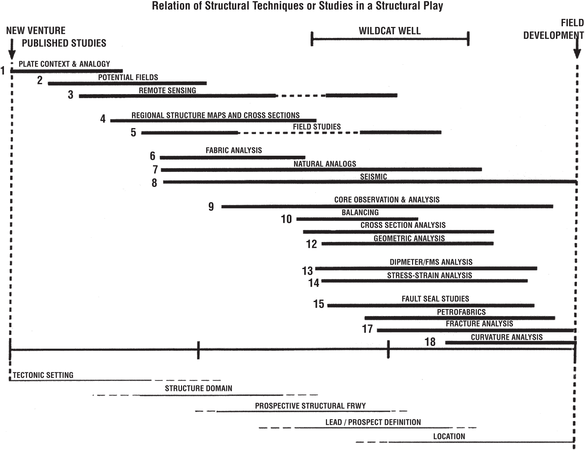
Figure 1 Structural exploration in the Laramide western Wyoming thrust belt in the late 1970s and early 1980s.
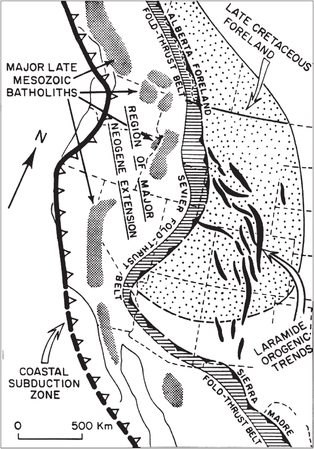
Figure 2 Tectonic setting for the western U.S. relevant to Laramide plate tectonics. From Schwartz[1]; courtesy Rocky Mountain Association of Geologists.


Figure 2 depicts the tectonic setting for the western U.S. relevant to Laramide plate tectonics. It shows where overthrusting took place, its overall geometry and vergence direction, and the interference with foreland deformation.
Structural domains[edit]

Structural domains within the Wyoming thrust belt were defined by the regional mapping of the U.S. Geological Survey[2] and by interpreting satellite images such as the one shown in Figure 3. Individual major thrust sheets were defined across the belt as well as their change in character along strike, thus defining domains on a large scale. Note that the small white rectangle in the center of the satellite image is the approximate area seen in the oblique aerial photograph in Figure 9.
Prospective structural fairways[edit]
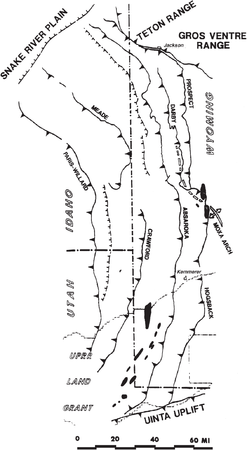
Figure 4 Satellite image showing the location of the major thrust sheets in the Wyoming thrust belt. From Dixon[3].


Within the structural domains, regional analysis of structural style and timing were integrated with other elements of the hydrocarbon system to define prospective fairways. Figure 4 covers approximately the same area as the preceding satellite image and shows the location of the major thrust sheets in the Wyoming thrust belt. Note that most of the oil and gas fields occur in the southern half of the Absaroka thrust sheet.
Figure 5 is a contoured fault-plane map at two different scales for the Absaroka thrust, the major thrust that contains the producing fairway.
Structural lead[edit]
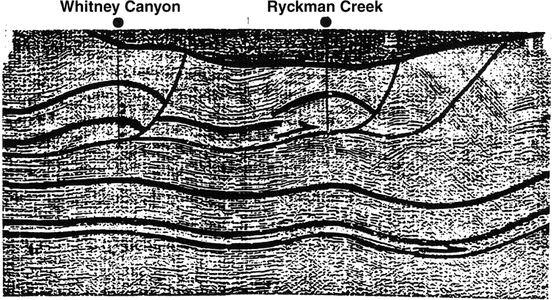
Figure 6 Interpreted seismic line in the approximate location of Figure 8.
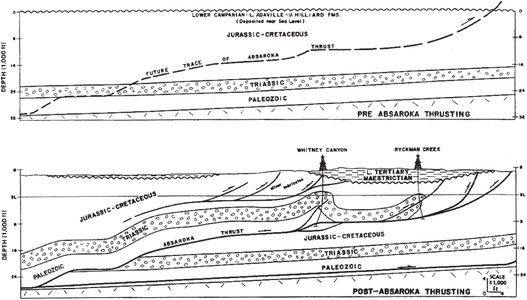
Figure 7 Restoration and balancing of a cross section through the Whitney Canyon and Ryckman Creek fields. From Sieverding and Royse[5].
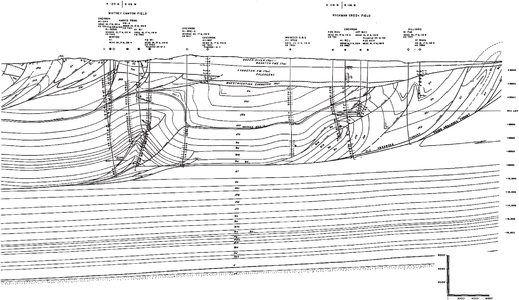
Figure 8 Cross section across the Whitney Canyon and Ryckman Creek producing structures in the upper plate of the Absaroka thrust. From Lamerson[6]; courtesy Rocky Mountain Association of Geologists.
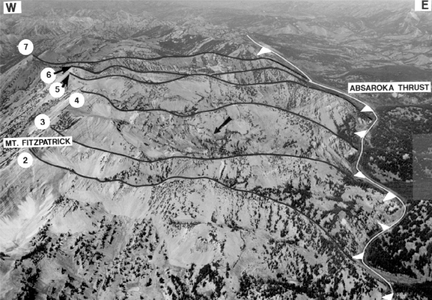
Figure 9 Structures in the upper plate of the Absaroka thrust in the central Wyoming thrust belt, updip and along strike of the producing structures in the same thrust sheet to the south.
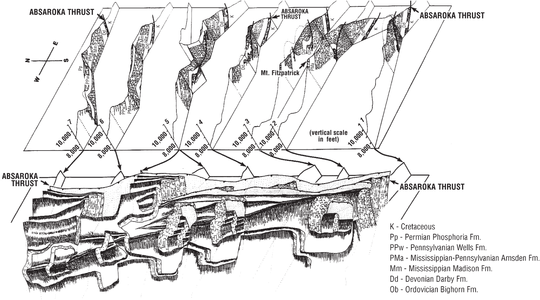
Figure 10 Structures in the upper plate of the Absaroka thrust fault on the south side of ridge line 4 in Figure 9. The white outcrops in the valley in the left foreground are tightly folded Ordovician Bighorn dolomite.


Detailed analysis of the fairway proceeded using surface and subsurface data. Examples of the data used are shown below.
Figure 8 shows a cross section across the Whitney Canyon and Ryckman Creek producing structures in the upper plate of the Absaroka thrust.
Figure 6 shows an interpreted seismic line in the approximate location of Figure 8.
Figure 7 shows restoration and balancing of a cross section through the Whitney Canyon and Ryckman Creek fields. Restoration and balancing help ensure that structures shown on cross sections are geometrically possible and geologically plausible.
The oblique aerial photograph in Figure 9 shows structures in the upper plate of the Absaroka thrust in the central Wyoming thrust belt, updip and along strike of the producing structures in the same thrust sheet to the south. (See Figure 3 for the location.)
The tectonic setting and stratigraphic section are similar to the producing trend; therefore, the deformation features of the exposed structures can be used as analogs for producing structures to the south. The numbered ridge lines in the photo provide a set of natural serial cross sections through the structures (Figure 10).
Figure 10 shows structures in the upper plate of the Absaroka thrust fault on the south side of ridge line 4 in Figure 9. The white outcrops in the valley in the left foreground are tightly folded Ordovician Bighorn dolomite.
Prospect and location[edit]
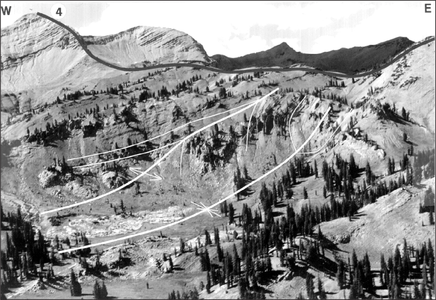
Figure 11 Photograph showing structures in the upper plate of the Absaroka thrust fault.
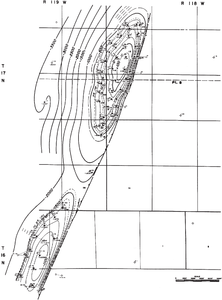
Figure 12 Example of detailed structural mapping at the prospect level. From Lamerson;[6] courtesy Rocky Mountain Association of Geologists.
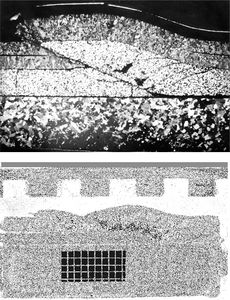
Figure 13 Physical models display structures similar in shape to natural, prospect-scale, thrust-related structures can provide insight on the overall geometry of the prospect and the location of zones of high strain (high fracture density?) within the structure. Published with permission of James Morse, Computational Geology.
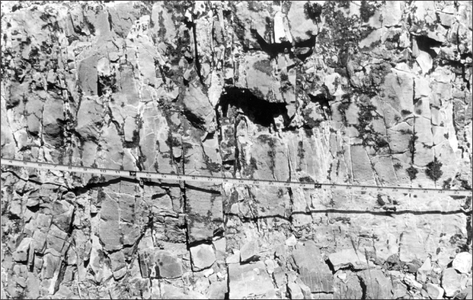
Figure 14 Examples of outcrop fracture-spacing data relevant to the carbonate section of Whitney Canyon field
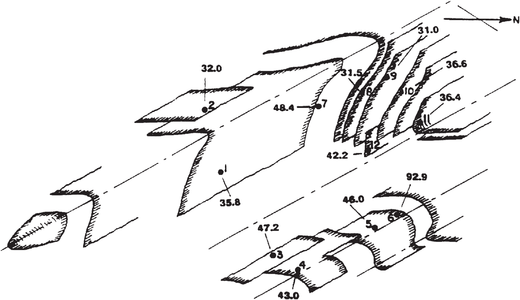
Figure 15 Outcrop sketch of folds in the Devonian Darby siltstone and Ordovician Bighorn dolomite. From Nelson and Serra[7]; courtesy Journal of Canadian Petroleum Technology.


Once leads have been defined, detailed analyses of individual well locations must take place. Figure 12 shows an example of detailed structural mapping at the prospect level. It is a structural map on top of the Upper Triassic Nugget Sandstone, Ryckman Creek field area, Uinta County, Wyoming. Contour interval varies from length::100 ft (30 m) near the crest of the structure to length::500 ft (150 m) on the flanks. The dashed contours are the oil/water and gas/oil contacts.
Physical models, such as those in Figure 13, that display structures similar in shape to natural, prospect-scale, thrust-related structures can provide insight on the overall geometry of the prospect and the location of zones of high strain (high fracture density?) within the structure. These insights can be useful in determining optimal well locations.
These models were constructed of originally planar layers of limestone, sandstone, and granite. They were deformed in a pressure vessel at an effective overburden pressure of 15 × 103 psi (1 × 10⁵ kPa). The top view is a photomicrograph of a model that simulates a thrust ramp. The bottom view simulates the hanging-wall geometry produced by movement along a series of bedding-parallel and ramp segments of a thrust fault.
Data on deformation mechanisms, such as fractures and how they affect reservoir properties, are obtained by integrating outcrop fracture data and laboratory estimates of fracture aperture. This integration allows for a direct calculation of fracture porosity and fracture permeability for the reservoir.
Examples of outcrop fracture-spacing data relevant to the carbonate section of Whitney Canyon field are shown in Figure 14. The photograph shows fractures in the Ordovician Bighorn dolomite in outcrops in the valley seen in Figure 11. (Note the inch-scale measuring tape stretched across the center of Figure 14.)
The outcrop sketch in Figure 15 is of folds in the Devonian Darby siltstone and Ordovician Bighorn dolomite from the same location as Figure 14. The numbers on the sketch represent fracture intensity values expressed as the average number of fractures encountered per foot of scanline measurement at various locations on the folds. All else being equal, higher fracture intensities should be associated with zones of higher fracture porosities and permeabilities. Maps of high fracture intensities can be used to locate optimum well locations and well trajectories in prospects.
Summary[edit]
This thrust belt example has shown the structural exloration process and some of the data types, techniques, and approaches that can be used in exploring for a structural trap.
See also[edit]
- Structural exploration workflow
- Tectonic setting
- Structural domains
- Structural fairway prospectivity
- Structural lead and prospect delineation
- Structural exploration:location selection
References[edit]
- ↑ Schwartz, R. T., 1982 Broken early cretaceous foreland basin in SW Montana: Sedimentation related to tectonism, in R. B. Powers, ed., Geological studies of the Cordilleran thrust belt: Rocky Mountain Association of Geologists, p. 159-183.
- ↑ Rubey, W., W., 1973, Geologic map of the Afton quadrangle and part of the big Piney quadrangle, Lincoln and Sublette counties, Wyoming: U., S. Geological Survey map I–686.
- ↑ 3.0 3.1 Dixon, J. S., 1982, Regional structural synthesis, Wyoming salient of the Western overthrust belt: AAPG Bulletin, v. 66, p. 1560-1580. Maps and sections.
- ↑ Bishop, R. A., 1982, Whitney Canyon-Carter Creek gas field, SW Wyoming, in R. B. Powers, ed., Geological studies of the Cordilleran thrust belt: Rocky Mountain Association of Geologists, p. 591-599.
- ↑ Sieverding, J. L., and F. Royse Jr., 1993, Whitney Canyon-Carter Creek Field-USA, in E. A. Beaumont and N. H. Foster, eds., Treatise of Petroleum Geology, Atlas of Oil and Gas Fields, Structural Traps III: AAPG, p. 1-29.
- ↑ 6.0 6.1 Lamerson, P. R., 1982, Fossil basin area and its relationship to the Absaroka thrust fault system, in R. B. Powers, ed., Geological studies of the Cordilleran thrust belt: Rocky Mountain Association of Geologists, p. 279-340.
- ↑ Nelson, R. A., and S. Serra, 1995, Vertical and lateral changes in fracture spacing in several folded carbonate sections and its relation to locating horizontal wells: Journal of Canadian Petroleum Technology, v. 34, p. 51-56.
External links[edit]
| find literature about Structural exploration: thrust belt example |