Flow units and containers
| Exploring for Oil and Gas Traps | |

| |
| Series | Treatise in Petroleum Geology |
|---|---|
| Part | Predicting the occurrence of oil and gas traps |
| Chapter | Predicting reservoir system quality and performance |
| Author | Dan J. Hartmann, Edward A. Beaumont |
| Link | Web page |
| Store | AAPG Store |
To understand reservoir rock–fluid interaction and to predict performance, reservoir systems can be subdivided into flow units and containers. Wellbore hydrocarbon inflow rate is a function of the pore throat size, pore geometry, number, and location of the various flow units exposed to the wellbore; the fluid properties; and the pressure differential between the flow units and the wellbore. Reservoir performance is a function of the number, quality, geometry, and location of containers within a reservoir system; drive mechanism; and fluid properties. When performance does not match predictions, many variables could be responsible; however, the number, quality, and location of containers is often incorrect.
What is a flow unit?
A flow unit is a reservoir subdivision defined on the basis of similar pore type. Petrophysical characteristics, such as distinctive log character and/or porosity-permeability relationships, define individual flow units. Inflow performance for a flow unit can be predicted from its inferred pore system properties, such as pore type and geometry. They help us correlate and map containers and ultimately help predict reservoir performance.
What is a container?
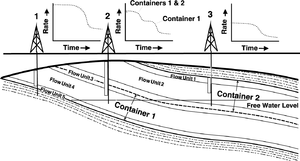
A container is a reservoir system subdivision consisting of a pore system, made up of one or more flow units, that responds as a unit when fluid is withdrawn. Containers are defined by correlating flow units between wells. Boundaries between containers are where flow diverges within a flow unit shared by two containers (Figure 1). They define and map reservoir geology to help us predict reservoir performance.
Defining flow units

To delineate reservoir flow units, subdivide the wellbore into intervals of uniform petrophysical characteristics using one or more of the following:
- Well log curve character
- Water saturation (Sw–depth plots)
- Capillary pressure data (type curves)
- Porosity–permeability cross plots (r35—defined later)
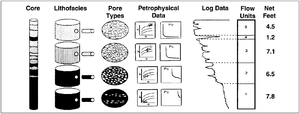
The diagram in Figure 2 shows how flow units are differentiated on the basis of the parameters listed above.
Example

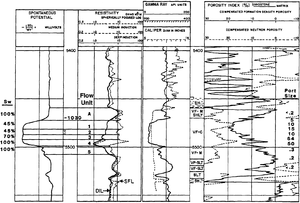
The example in Figure 3 from the Morrow Sandstone of southeastern Colorado illustrates flow unit definition using water saturation, log analysis, lithology, and mean pore throat size (pore size).
Procedure: defining containers
Defining containers within a reservoir system is relative to the flow quality of the rock. Flow units with the largest connected pore throats dominate flow within a reservoir system. Follow the steps listed in the table below as a method for defining containers.
- Correlate flow units between wells in strike and dip-oriented structural and stratigraphic cross sections.
- Identify the high-quality flow units from rock and log data.
- Draw boundaries between containers by identifying flow barriers or by interpreting where flow lines diverge within flow units common to both containers.
Impact of container quality and drive
Figure 1 is a cross section of a reservoir system in an unconformity truncation trap. The reservoir system contains two different containers characterized by pore systems of different quality. Flow units 1 and 3 are microporous; flow units 2 and 5 are mesoporous; and flow unit 4 is macroporous. Container 1 is comprised of flow units 4 and 5 and part of 3. It has a strong water drive. Container 2 is comprised of flow units 1, 2, and part of 3. It has a partial water drive. The boundary between containers 1 and 2 is where fluid flow diverges in flow unit 3. Container 1 is of higher quality in terms of performance capability.
Three wells in the figure drain the reservoir. Next to each well is a decline curve. We can consider how container quality and drive affect well performance:
- Well 1 has the highest performance because it drains the reservoir portion of container 1, which has the highest quality in terms of its pore system and aquifer support.
- Well 2 drains the reservoir portion of containers 1 and 2. Initial flow is relatively high but falls rapidly as it drains its portion of container 1. It flattens as it continues to drain container 2.
- Well 3 drains container 2. Initial flow is lowest because of the poor quality of its pore system and aquifer support. It has the poorest performance.
Flow units, facies, and containers

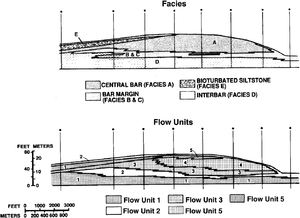
The stratigraphic cross section in Figure 4 shows the facies and flow units present in the Hartzog Draw field of Wyoming. The producing formation is the Upper Cretaceous Shannon Sandstone, composed of fine- to medium-grained clayey and glauconitic sandstones deposited as marine shelf bars. Notice how facies and flow units do not always correspond, especially within the central bar facies. The flow units in this section of Hartzog Draw behave as a unit; therefore, only one container is present.
Flow unit and container upscaling
In many cases, the reservoir system model must be oversimplified because of lack of time or data. For example, a reservoir system with thick sections of thin, interbedded sands and shale can theoretically be subdivided into thousands of flow units. Instead, we settle for averaging that section into one flow unit because the time to correlate each flow unit throughout the reservoir system is not available or because only log data are available and the thin beds are beyond the resolution of the tool. When only seismic data are available, we may only be able to define containers by the resolution of the seismic data.
See also
- Reservoir system
- Analyzing a reservoir system
- Reservoir drive mechanisms
- Predicting reservoir drive mechanism
References
- ↑ 1.0 1.1 Ebanks, J., N. H. Scheihing, and C. D. Atkinson, 1993, Flow units for reservoir characterization, in D. Morton-Thompson and A.M. Woods, eds., Development Geology Reference Manual: AAPG Methods in Exploration Series 10, p. 282–285.
- ↑ Hartmann, D. J., and E. B. Coalson, 1990, Evaluation of the Morrow sandstone in Sorrento field, Cheyenne County, Colorado, in S. A. Sonnenberg, L. T. Shannon, K. Rader, W. F. von Drehle, and G. W. Martin, eds., Morrow Sandstones of Southeast Colorado and Adjacent Areas: RMAG Symposium, p. 91-100.
