Fluid inclusions: analysis and applications
| Wiki Write-Off Entry | |
|---|---|

| |
| Author | Ibrahim Alfraih and Maram AlSaif |
| Affiliation | EXPEC ARC |
| Competition | 2021 Middle East Wiki Write Off |
Tracing fluid movement in sedimentary basins is crucial for understanding petroleum systems. Hydrocarbon migration remains one of the challenging topics, given the many uncertainties associated with petroleum migration. A first understanding at mapping hydrocarbon migration can be gleaned from basin modeling, augmented by pressure-volume-temperature (PVT) measurements at reservoir conditions and the analysis of core and fluids collected during testing and production. The first step in predicting the initial petroleum composition generated from the source rock is to analyze the exact hydrocarbon generation kinetics from the source rock in question. Predictions can only be tested by drilling. Recovered fluids can then be studied geochemically and results can be used to calibrate predictions from basin models regarding the presumed source rock and predicted fluids. Reconstructing migration and fill history in reservoirs that received multiple charging can, however, pose a challenge, as fluids in this case represent the average composition of the various charges. Fluid inclusions entrapped within rock matrix and healed fractures during diagenesis and trap filling offer a unique tool to reconstruct reservoir filling history and petroleum migration Figure 1. Hydrocarbon-bearing fluid inclusions (HCFIs) encapsulate accumulating or migrating oil and gas at reservoir conditions, which allows for the original fluid composition and trapping temperatures and pressures (P-T) to be reconstructed.[1] [2] [3]
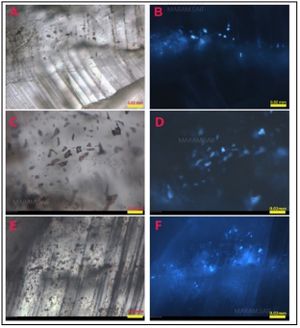
The analysis and interpretation of petroleum inclusion data, however, is not straightforward. Several destructive and nondestructive analytical methods are typically used in fluid inclusion studies Figure 2. Four types of data can be obtained through analyzing and modeling fluid inclusions:
- Textures
- Fluid composition
- Fluid properties
- Pressure-temperature of trapping
Overview[edit]
What are fluid inclusions?[edit]
Fluid inclusions are tiny bubbles commonly found in natural mineral crystals of rocks.[6] Fluid inclusions form as imperfections during crystal growth in the presence of a fluid phase.[7]
The trapped fluid may contain liquid, solid, and gaseous phases, depending on the fluid source and the pressures–temperatures experienced and the composition of the entrapped fluids. These phases may commonly include pure water, brines of various salinities, dissolved gases, salts, and hydrocarbons. Inclusions that contain hydrocarbons are of main interest in the oil and gas industry. Petroleum inclusions generally develop in diagenetic cements or grains. They contain a complex mixture of mainly organic compounds, depending on their sources.[6]
Accurate analysis of these chemical components can generate important information about the history, evolution, and migration of petroleum fluids. A significant advantage of studying the hydrocarbons trapped in the inclusions is that they are sealed from any processes that commonly deteriorate the petroleum fluids as they migrate throughout geological time. Petroleum inclusions are protected from events such as loss of charge, water washing, or biodegradation. Inclusions also preserve the fluids from contamination during the drilling processes used to extract samples from reservoirs.[8]
How are fluid inclusions formed?[edit]
One of the essential steps to determine how the fluids were trapped is to analyze the relationships between fluid inclusion assemblages, mineral growth, or fracture healing. Three different types of fluid inclusions are commonly observed.
- Primary fluid inclusions are formed during the growth of the surrounding host crystal so the fluid is trapped on the active growing surface of a crystal.
- Secondary fluid inclusions are formed when fluids are trapped after the crystal growth is complete. After the mineral precipitation in a rock is complete, the crystals commonly deform by brittle and ductile processes. These deformations result in the development of fractures in the crystals in which the fluid infiltrates and becomes trapped as secondary fluid inclusions as the fractures heal.[9]
- Pseudo-secondary fluid inclusions form when deformation features form during crystal growth and the fluids become trapped in the fractures followed by additional crystal growth.[9]
Effects of geological processes on fluid inclusions[edit]
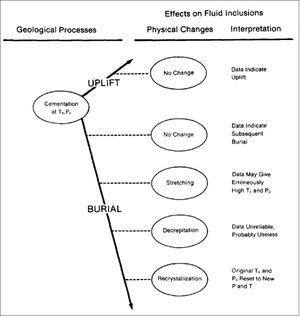
Along the process of cementation and crystal growth, different physical changes could affect the fluid inclusions. Fluid inclusions typically are entrapped at a specific temperature (Tc) and pressure (Pc) conditions. Through geological time, some processes could influence entrapped fluid inclusion properties at different levels Figure 3. For example, uplift events are believed to have no influence on fluid inclusions.[5] Deep burial can influence the initial fluid inclusion properties, causing stretching and re-crystallization. The fluid inclusions and other aspects of the rock chemistry can be completely reset. New pressure and temperature conditions can be interpreted but are not representative of entrapment temperature and pressure.[5]
Instrumentation and analytical methods[edit]
Petroleum inclusions are routinely studied by two different methods as shown in Figure 2. The first method is the nondestructive, where various properties are analyzed without damaging the original fluid inclusion. This method includes petrographic description, followed by microthermometric and fluorescence spectroscopic studies. The second method is the destructive, where the original fluid inclusions are crushed open to release the entrapped fluids for bulk or individual compositional analysis.

Nondestructive methods[edit]
Petrography[edit]
The petrographic study of petroleum inclusions is usually based on fluorescence behavior, color, and the number of fluid phases at room temperature and their relative proportions:
- Texture and morphology: The physical occurrence of fluid inclusion is described relative to the rock mineralogy and associated features such as fractures, diagenetic cement, and crystal growths, which helps classify fluid inclusions.
- Fluorescence: Hydrocarbons emit light in the visible range when exposed to ultraviolet (UV) light. The different fluorescence colors reveal information about the composition of the hydrocarbons.
- Color: Petroleum inclusions are commonly colorless or brown. The color reflects information about the composition and the size of the inclusion.
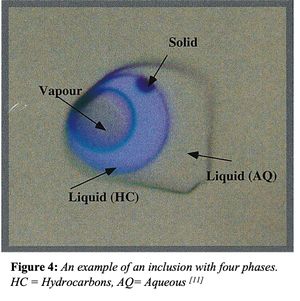
- Phases: Two phases are mainly present in petroleum inclusions at room temperature: liquid and vapor. Composition and density are the two main factors that control the proportion of liquid and vapor. Vapor bubbles, for example, dominate inclusions of gas condensate more than inclusions of black oil. A black solid and an aqueous phase are also two less commonly observed phases in petroleum inclusions, as shown in Figure 4.[3]
Microthermometry[edit]
Microthermometric studies refer to the determination of temperatures of phase changes within fluid inclusions during heating and cooling of the sample under the microscope. Two assumptions are made before initiating microthermometry: (a) The inclusion has been completely sealed since the time of entrapment, and (2) the volume of an inclusion remained constant since entrapment. One of the essential microthermetric parameters is the homogenization temperature, which is defined as the minimum temperature of trapping. The homogenization temperature is the temperature at which the bubble in the inclusion disappears and homogenizes in the liquid upon heating. Identifying the homogenization temperature requires a cycling technique of heating and cooling to get to the exact temperature (Figure 5).
After determining the homogenization temperature at the high-temperature phase analysis, the inclusions could be examined at low temperatures. Microthermometry at low temperatures provides insight into the composition of the fluid inclusions and allows the bulk salinity of the inclusion’s aqueous phase to be estimated. Determining the salinity helps differentiate between freshwater and sweater and analyze the paleo conditions of the oil-water contact.[9]

Fluorescence spectroscopy[edit]
Excitation by UV light causes petroleum fluids to fluoresce in the visible range (400-700 nm). The main purpose of using fluorescence spectroscopy is to test fluid inclusions for the presence of hydrocarbons. Fluorescence emissions also correlate to API gravity, since different chemical compositions will emit varying degrees of fluorescence wavelengths. Heavier oils show fluorescence emissions at higher wavelengths than lighter oils, thereby emitting different colors (Figure 6).
Destructive methods[edit]
Screening methods[edit]
Initial screening for fluid inclusions is essential to ensure sufficient hydrocarbon fluid inclusions are present in the sample. Two petrographic screening methods are initially applied, followed by two chemical screening methods.
- Grains-containing Oil Inclusions (GOI®): A petrographic approach to measure the frequency of hydrocarbon inclusions contained within quartz grains in order to identify zones of paleo-oil saturation.[10]
- Quantitate Grains with Fluorescence (QGF®): A petrographical approach to quantify the micro-sized inclusions containing hydrocarbons using fluorescence.
- Fluid Inclusion Stratigraphy (FIS®): A chemical screening approach to detect hydrocarbon presence. Samples are crushed to liberate the fluid inclusions and subsequently analyzed by a mass spectrometer.
- Thin Layer Chromatography with Flame Ionization Detector (TLC-FID): Another chemical approach to quantify the micro-extracted fluids for their petroleum fractions (saturates, aromatics, resins, and asphaltenes).[11] [12]
These quick and cost-effective screening methods allow for identifying best zones for high-resolution sampling and subsequent geochemical analyses.
Compositional analysis[edit]
After finding hydrocarbon fluid inclusions, destructive crushing methods are applied to prepare the samples for compositional analysis. Two methods of destructive crushing have been reported: online crushing and offline crushing.
Offline crushing: The technique liberates trapped hydrocarbons by crushing the mineral matrix using an organic solvent followed by a specific filtration procedure.[8] The extracted fluid inclusions are then fractionated into saturates, aromatics, resin, and asphaltene for comprehensive compositional analysis of saturates and aromatics using gas chromatography (GC), gas chromatography – mass spectrometry (GC-MS), and gas chromatography-isotope-ratio-mass-spectrometry (GC-IRMS).[4] [8] Gases and light hydrocarbons are normally lost during the separation, and the online crushing is preferred if their compositions are to be determined.
Online crushing: The crushing device is directly connected to the analyzer of the GC-MS or the GC-IRMS. Liberated products, including gases and light hydrocarbons, are collected cryogenically using liquid nitrogen before they are released to the GC-MS. These methods allow for the molecular and isotopic analyses from only a few milligrams of rock material containing fluid inclusions, and hence the analysis of the different inclusion populations ̶ as determined petrographically.[8] [3]
Collectively, these methods allow for proper geochemical characterization of the hydrocarbon composition of fluid inclusions. This has various petroleum applications, such as fluid fingerprinting, mapping fluid migration, and reconstruction of reservoir filling history and diagenesis.[13] [4]
Applications[edit]
Fluid inclusions have numerous applications in petroleum system analysis and reservoir diagenesis studies, such as unraveling reservoir filling history and estimating pressure and temperature conditions of petroleum migration. The following are some of the many applications used in the oil industry:[9]
- Interpretation of petroleum migration and reservoir fill history
- Fluid correlation in space and time
- PVT characterization: Pressure and temperature interchanges can be recorded from the HCFIs. In addition HCFIs P-T assessment and correlation could alter an understanding of volumetrics of a given resource.[2] Using PVT characterization, petroleum geochemists can reach conclusions in terms of inclusions entrapment, correlation of charge migration and cementation.[14]
- Reconstruction of thermal history
- Reconstruction of tectonic or stratigraphic history
- Improved understanding of diagenetic systems and porosity evolution
Case Studies[edit]
Vulcan Sub-basin, Northern Australia (charge timing)[edit]
Fluid inclusions were used to reconstruct the relative timing of petroleum charge in the Jabiru field.[8] Produced crude oil and oil inclusions showed similar source biomarkers but different thermal maturities, suggesting that the oil inclusions formed earlier than the dominant present-day charge of the reservoir.
Barrow Sub-basin, Western Australia (charge source)[edit]
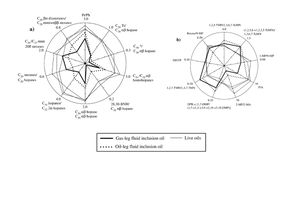
Using fluid inclusions, multiple source kitchens were identified at the South Pepper-1 well in Barrow Sub-basin, Western Australia.[8] Variations among aliphatic and aromatic biomarkers suggest the Upper Jurassic claystone as the source for the produced oil, and a calcareous source for the inclusion oil (Figure 7). The newly identified calcareous source was only possible to identify using fluid inclusions.
Wealden Basin, Southern England (fluid type, migrations pathways and burial history)[edit]
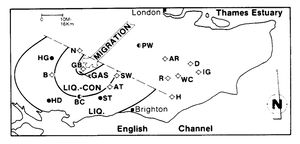
In Southern England, an understanding of a hydrocarbon play was based on fluid inclusions studies. Migration pathways of hydrocarbons was determined by observing the distribution of HCFIs. In addition, the associated fluid type was estimated through observing compositions of entrapped fluids (Figure 8).
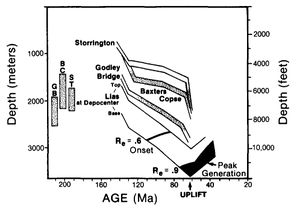
From the same location, sediments uplift was recorded in terms of timing and extent. This understanding was established using fluid inclusions temperature (Th) utilizing assessment of calcite cements. Ultimately generating a burial history diagram (Figure 9).
See also[edit]
- 2021 Middle East Wiki Write Off
- Super basins
- Structural restoration
- Condensate banking effect
- Fault seal analysis for reservoir development
References[edit]
- ↑ Bourdet, J., Pironon, J., Levresse, G., Tritlla, J., 2008. Petroleum type determination through homogenization temperature and vapour volume fraction measurements in fluid inclusions. Geofluids 8, 46–59.
- ↑ 2.0 2.1 Goldstein, R.H. 2001. Fluid inclusions in sedimentary and diagenetic systems. Lithos, 55, 1-4, 159-193
- ↑ 3.0 3.1 3.2 3.3 Munz, I.A. 2001. Petroleum inclusions in sedimentary basins: systematics, analytical methods and applications.
- ↑ 4.0 4.1 4.2 Atwah, I., Mohammadi, S., Moldowan, M., Dahl, J., 2021. Episodic hydrocarbon charge in tight Mississippian reservoirs of Central Oklahoma, USA: Insights from oil inclusion geochemistry. Marine and Petroleum Geology 123.
- ↑ 5.0 5.1 5.2 5.3 5.4 R, McLimans. 1987 The application of fluid inclusions to migration of oil and diagenesis in petroleum reservoirs. Applied Geochemistry, 2, 5-6, 585-603
- ↑ 6.0 6.1 Blamey, N.J.F., Ryder, A.G., 2009. Hydrocarbon fluid inclusion fluorescence: a review. In: Geddes, C.D. (Ed.), Reviews in Fluorescence 2007. Springer, New York, USA.
- ↑ Samson, I., Anderson, A., Marshall, D., 2003. Fluid Inclusions: Analysis and Interpretation. Short Course Series vol. 32, 374.
- ↑ 8.0 8.1 8.2 8.3 8.4 8.5 8.6 George, S.C. Volk, H. Ahmed, M. 2007. Geochemical analysis techniques and geological applications of oil-bearing fluid inclusions, with some Australian case studies” (Journal of Petroleum Science and Engineering, 57, 1-2,119-138)
- ↑ 9.0 9.1 9.2 9.3 9.4 9.5 Goldstein, R.H. and Reynolds, T.J. 1994. Systematics of fluid inclusions in diagenetic minerals. SEPM Short Course.
- ↑ Volk, H. and George, S.C. 2019. Using petroleum inclusions to trace petroleum systems – A review. Organic Geochemistry., 129,99-123.
- ↑ Bhullar, A., Karlsen, D., Lacharpagne, J., Holm, K., 1999. Reservoir screening using Iatroscan TLC-FID and identification of palaeo-oil zones, oil–water contacts, tar-mats and residual oil saturations in the Frøy and Rind petroleum accumulations. Journal of Petroleum Science and Engineering 23, 41-63.
- ↑ Karlsen, D.A., Larter, S.R., 1991. Analysis of petroleum fractions by TLC-FID: applications to petroleum reservoir description. Organic Geochemistry 17, 603-617.
- ↑ Arouri, K.R., Jenden, P.D., Al-Hajji, A.A., 2010. Petroleum inclusions atop Unayzah gas condensate reservoir: signpost for an undocumented chapter of the Arabian Basin filling history? Organic Geochemistry 41, 698–705
- ↑ Teinturier, S., Pironon, J., Walgenwitz, F., 2002. Fluid inclusions and PVTX modelling: examples from the Garn Formation in well 6507/2-2, Haltenbanken, Mid-Norway. Mar. Pet. Geol. 19, 755–765.
