Log interpretation: initial quick scan
| Basic Well Log Analysis, 2nd Edition | |

| |
| Series | Methods in Exploration |
|---|---|
| Chapter | Log Interpretation |
| Author | G. Asquith and D. Krygowski |
| Link | Web page |
| PDF file (requires access) | |
| Store | AAPG Store |
Determining the porosity and true resistivity of a zone is the first step in converting the raw log data into estimated quantities of oil, gas, and water in a formation. These estimated quantities are used to evaluate a zone and to determine whether a well completion attempt is warranted. As important as this log-derived information is, however, it should not be applied without the inclusion of other data. This statement is, perhaps, obvious, but it can't be overemphasized. A geologist should always consider every item of relevant data, such as drill stem tests, sample shows, mud-log analysis, nearby production, etc., before making a decision to set pipe.
It is exceedingly rare that a log contains more reservoir than nonreservoir information, and when one is unfamiliar with an area or wants to broadly reconnoiter an area, a scanning technique that sorts reservoir from nonreservoir can be helpful, even with access to computer-aided processing. A good scanning technique not only identifies the reservoirs, but can also give the geologist hints as to potential pay and wet zones. Remember that in the interpretive process, the identification of wet zones is as important as the discovery of those containing hydrocarbons, because the comparison of the two helps clearly identify both the presence and amount of the hydrocarbons.
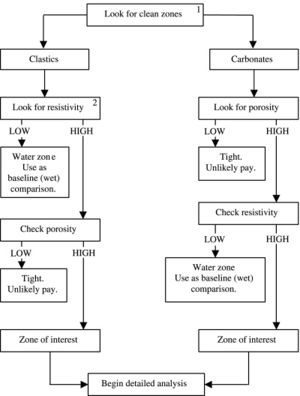
Figure 1 is a flowchart for one such scanning technique. Note that it has two paths, one for clastics and one for carbonates. In the clastic case, the resistivity log is the primary reconnaissance measurement because clastics tend to consist of reservoirs surrounded by shales of slowly varying resistivity. The changes in resistivity due to changes in fluid content of the reservoirs tend to stand out against this relatively constant background. On the carbonate path, on the other hand, formation resistivities tend to vary widely with changing rock types, and commonly there are few shales against which to measure changes. In this case, the porosity log is the primary reconnaissance measurement. By first finding the porous zones, those with the capacity to hold fluids (of any type) can be identified.

See also
References
- ↑ Asquith, G., and D. Krygowski, 2006, Basic Well Log Analysis, 2nd Edition: AAPG Methods in Exploration 16, 244 p.