Production histories
| Development Geology Reference Manual | |
| |
| Series | Methods in Exploration |
|---|---|
| Part | Production engineering methods |
| Chapter | Production histories |
| Author | Brent Hale |
| Link | Web page |
| Store | AAPG Store |
Production histories of gas and oil wells can be analyzed to estimate reserves and production rates and to validate results of complex reservoir studies. Because accurate production data are commonly available on most wells, production data analyses can be widely applied by the production engineer. Two main analysis methods are decline curve analysis and type curve analysis. These methods are simple and economic to apply and can provide valuable data on the quality of the reservoir. Decline curves are generally easy to use, but type curves usually provide better forecasts for complex reservoirs. If large risks or large capital expenditures are needed to conduct a project, well testing and simulation can be used to supplement and/or upgrade the quality of forecasts generated by production histories (see Production testing and Reservoir stimulation).
Decline curve analysis
Decline curve analysis relates past performance of gas and oil wells to future performance, but it does not anticipate changes in performance due to operating conditions or changes in reservoir behavior (for more on decline curves, see Reserves estimation.)
Constant percent decline
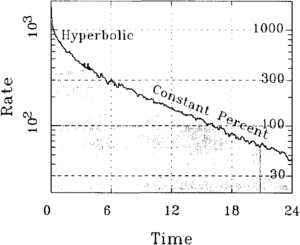
When the production decline rate is a constant, constant percent decline can be used effectively to forecast future performance. The log of flow rate is plotted versus time. In Figure 1, a straight line exists from 6 years to 24 years. This constant decline can be extrapolated to determine future rates with the following equation:
where
- q = production rate at time t
- qi = initial rate
- D = decline rate
- t = time
Reserves, Np, or the volumes produced over the life of a project are
where qa = abandonment flow rate
This equation directly relates reserves to the rate change over the life of the well and to the constant percent decline rate for the well.
Harmonic and hyperbolic decline
Harmonic and hyperbolic decline are variations of constant percent decline. The decline rate changes as a well ages, as seen from 0 to 6 years in Figure 1. An additional constant, n, which describes how the initial decline rate, Di, changes with time is needed to describe the flow behavior during years 0 through 6 in Figure 1. The rate equation is
where n varies from 0 to 1 but is constant for a single decline curve. Harmonic decline is a special case in which n = 1. To compute reserves, the following equation is used:
The mathematics here are more complex than for constant percent decline, but are necessary to describe more complex production histories.
Type curve analysis
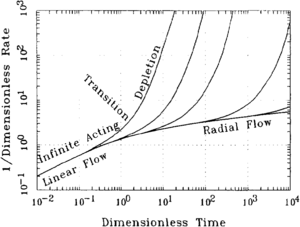
Type curves differ from decline curves in one important respect: type curves are theoretical forecasts of reservoir performance and can be used to forecast reservoir behavior that has not yet been observed. Because there are many different types of reservoirs, a great variety of type curves have been generated. Type curves are generated using analytical or numerical solutions to Darcy's law. A simple type curve is shown in Figure 2. The reciprocal dimensionless rate is plotted versus dimensionless time. The curve is suitable for wells produced at constant pressure where the rate declines as a function of rime. (For more information on dimensionless variables and type curves, see Pressure transient testing.)
Flow regions
Three flow regions can exist on a typical type curve, such as that illustrated in Figure 2. These are the infinite acting region or unsteady-state region, the transition region, and the semi-steady-state region. Early in its producing life, a well acts as if it is produced from an infinitely large reservoir. Flow rate decreases rapidly as a well produces because fluids must move increasingly longer distances to get to the well. The constantly changing rates are called unsteady-state rates. As boundaries are encountered, a transition occurs and rate changes begin to reflect depletion of gas or oil in a limited reservoir. Fully developed boundaries result in production at steady-state rates if produced fluids are replaced by water influx. If the reservoir pressure decreases as a well is produced, the flow rate will also decrease. Semi-steady-state is defined as the production mechanism when the pressure everywhere in the reservoir is declining uniformly.
Dimensionless variables
Most type curves are presented using dimensionless rate or dimensionless pressure versus dimensionless time. Both axes of the graphs are presented as logarithms. Data are multiplied by a constant to generate dimensionless variables for convenience so that a single type curve can be used for different wells with different reservoir properties.
A typical analysis consists of three main phases. First, an appropriate type curve must be selected by answering the following questions. Are we analyzing a gas or oil reservoir? Does it have high or low permeability? Is the reservoir naturally fractured? Is it necessary to consider complex rock and fluid properties? Did the well produce at a constant rate or a constant pressure?
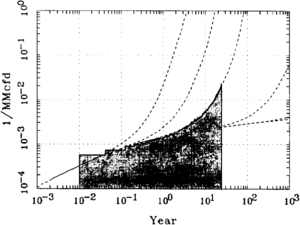
Second, production data must be graphed according to the requirements of the type curve being used for the analysis. By graphing the reciprocal rate versus time (Figure 3) for a well producing at constant pressure, one can then use the appropriate type curve to analyze the field data.
Finally, the data are matched to the type curve. When the match is complete, the axes of the type curve and the production curve are compared to determine the constant difference between them. With this relationship, the future performance can be forecast either graphically or by using computer models.
Flow systems
Either linear flow or radial flow is commonly used to analyze production data and to forecast reserves. In linear flow systems, fluid flows in parallel paths to a fracture. In radial flow systems, fluid flows in a path that converges to the wellbore, causing high pressure drops near the wellbore because of high fluid velocity (see Fluid flow fundamentals).
Linear flow is observed as a straight line (Figure 2) on a log Δp or log 1/q versus log Δt graph of field data. Linear flow is common in low permeability reservoirs where pressure changes very slowly and fluids move slowly through the reservoir. Radial flow is expected in wells with high permeability or in old wells where the drainage area is large.
Although low permeability is necessary for linear flow to occur over an extended time period, a hydraulic fracture must also exist or the linear flow patterns will quickly change to radial flow patterns. This change is where the straight line begins to curve to the right (Figure 2). After it begins, radial flow dominates production until depletion occurs.
Other factors
A number of factors can influence production data and cause it to deviate from ideal trends. The most common is well damage that results in higher than expected pressure drops near the wellbore and lower than expected production rates. Often, well damages change as a function of time due to factors such as scale deposition, salt or sulphur deposition, and the use of inhibitors in the tubing string. Another factor can be wellbore storage, which is the accumulation or depletion of gas in a wellbore as pressures increase or decrease. This storage of gas distorts wellhead flow measurements. If the impact of storage and damage is not recognized and accounted for in the analysis, the resulting forecast can be incorrect.
Well surveillance
Production history analysis has significant economic and conservation benefits. Production problems need to be identified and corrected as soon as possible, usually with a workover. To justify a workover economically, the engineer has to predict future performance under existing conditions and what would be expected after the workover. Incremental production or environmental protection must justify the cost of any workover project. Monitoring completed projects is necessary to determine which workovers are successful and should be used in the future and which should not be applied to future wells.
By monitoring well performance, one can observe if and when the actual well production deviates from the expected decline rate. Table 1 illustrates possible reasons for deviation.
| Deviation | Reasons |
|---|---|
| Production higher than expected |
|
| Production lower than expected |
|
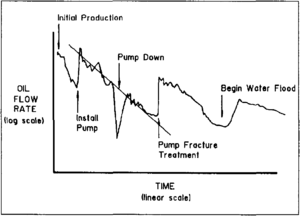
The information in Figure 4 illustrates how decline curves can be used to understand the production behavior of a well. In this figure, one can see that changes in operating conditions change the decline curve. Reserves and economics can be forecast by using exponential decline curve fits to the production data.
See also
- Production testing
- Artificial lift
- Surface production equipment
- Stimulation
- Introduction to production engineering methods
- Pressure transient testing
- Well completions
- Production logging
- Production problems
- Workovers
