Pyrolysis gas chromatography
| Exploring for Oil and Gas Traps | |

| |
| Series | Treatise in Petroleum Geology |
|---|---|
| Part | Critical elements of the petroleum system |
| Chapter | Evaluating source rocks |
| Author | Carol A. Law |
| Link | Web page |
| Store | AAPG Store |
Pyrolysis gas chromatography (Py-GC) is anhydrous thermal decomposition of a material that leads to the conversion of kerogen to hydrocarbon compounds. Py-GC can be conducted on whole rock or isolated kerogen samples to obtain a visual signature or “fingerprint” of the organic material present.
When kerogen is pyrolyzed and the products are analyzed by gas chromatography, those products can be similar to those present in oils. One can compare the pyrolysis products either with the products of natural generation (oil) or with the products of laboratory pyrolysis of the asphaltenes from oils. Both comparisons are useful for oil–source rock correlations. Oil–oil correlations can also be carried out by comparing products of asphaltene pyrolysis from the various oils.
Dry vs hydrous pyrolysis
Two different pyrolysis techniques can be employed. Dry Rock-Eval pyrolysis is technically simpler but yields products rather different from those in natural systems. It is therefore more difficult and risky to use as a detailed correlation tool.
In contrast, hydrous pyrolysis techniques, where source rock candidates are artificially matured at relatively high temperatures in the presence of liquid water, can be very helpful in correlating oils to source rocks since it yields products that are fairly similar to those obtained by natural maturation. Hydrous pyrolysis experiments are also particularly helpful when only immature source rock candidates are available. These source rocks can be “matured” experimentally, and the resulting expelled “oil” can be compared to other oils.
How to read gas chromatograms
Gas chromatography generally is a qualitative tool. It is not typically used as a quantitative measurement of hydrocarbon molecules. However, the patterns generated in the chromatograms can help us determine if a source rock will be oil or gas prone.
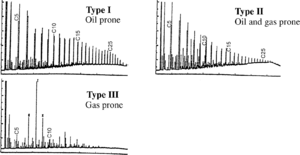
The X-axis of a gas chromatogram is retention time, and the Y-axis is the relative quantity of each compound. Each spike in the chromatogram represents a particular hydrocarbon compound, beginning with lowest number of carbon atoms in the compound on the left and going to higher chains of carbons to the right. The height of the spike represents the relative abundance of the compound pyrolized from the sample's kerogen. Typical gas chromatogram examples for types I, II, and III kerogen are shown in Figure 1.
Interpreting gas chromatograms

A gas chromatogram is evaluated qualitatively to determine the potential of a rock to generate oil vs. gas. The table below shows how chromatograms for oil- vs. gas-prone rocks are evaluated.
| Chromatograms of oil-prone rock | Chromatograms of gas-prone rock |
|---|---|
| Dominated by long-chain carbon compounds (greater than C10) | Dominated by short-chain carbon compounds from C1 –C4 |
| Contain carbon compounds up to C25 or greater | Contain very few carbon compounds above C10 |
Example
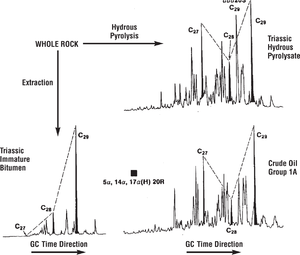
Figure 2 shows sterane m/z 217 mass fragmentograms of an immature rock extract (bottom left), a hydrous pyrolyzate (top right), and the correlatable oil (bottom right). The carbon-number distribution changes during pyrolysis, indicating a fundamental difference in composition between the immature extract and the kerogen. The pyrolyzate, however, is molecularly very similar to the oil.
See also
- Gas chromatography
- Gas chromatography: data obtained
- Gas chromatography/mass spectrometry (GC/MS): procedures
- Gas chromatography/mass spectrometry (GC/MS): examples of correlations
- Gas chromatography/mass spectrometry (GC/MS): limitations
- High-performance liquid chromatography
- Kerogen types
- Rock Eval analysis using hydrogen index (HI) and oxygen index (OI)
References
- ↑ Moldowan, J. M., C. Y. Lee, P. Sundararaman, T. Salvatori, A. Alajbeg, B. Gjukic, G. J. Demaison, N. E. Slougue, and D. S. Watt, 1992, Source correlation and maturity assessment of select oils and rocks from the central Adriatic Basin (Italy and Yugoslavia), in J. M. Moldowan, P. Albrecht, and R. P. Philp, eds., Biological markers in sediments and petroleum: Englewood Cliffs, New Jersey, Prentice-Hall, 411 p.
