Difference between revisions of "Interpreting hydrocarbon shows"
Cwhitehurst (talk | contribs) |
Cwhitehurst (talk | contribs) m (added Category:Treatise Handbook 3 using HotCat) |
||
| Line 119: | Line 119: | ||
[[Category:Predicting the occurrence of oil and gas traps]] | [[Category:Predicting the occurrence of oil and gas traps]] | ||
[[Category:Predicting reservoir system quality and performance]] | [[Category:Predicting reservoir system quality and performance]] | ||
| + | [[Category:Treatise Handbook 3]] | ||
Latest revision as of 17:09, 5 April 2022
| Exploring for Oil and Gas Traps | |

| |
| Series | Treatise in Petroleum Geology |
|---|---|
| Part | Predicting the occurrence of oil and gas traps |
| Chapter | Predicting reservoir system quality and performance |
| Author | Dan J. Hartmann, Edward A. Beaumont |
| Link | Web page |
| Store | AAPG Store |
One powerful use of petrophysical analysis is in interpreting shows. An understanding of the interrelationship of water saturation, relative permeability, pore throat-size distribution, and height above the free water level lets us interpret the significance of a hydrocarbon show.
Types of shows[edit]
Direct indications of hydrocarbons—seen in drilling fluids, cuttings, cores, or formation tests—may be of several types:[1]
| Show type | Significance | Origin |
|---|---|---|
| Continuous phase | Trapped oil or gas | A slug or filament of oil or gas with a continuous connection through the pore network of a rock |
| Residual | Migrated hydrocarbons | A discontinuous phase of oil or gas which formed as a result of a breached or leaky trap |
| Dissolved gas | Gas present in the petroleum system | Gas exsolving from formation water from pressure release |
| In kerogen | Oil or gas present in source rock | Oil liberated from kerogen in the oil generation phase |
Oil show type manifestations[edit]
The table below lists similarities and differences between different oil show types.
| Show type | Core or cuttings | Mud log | Sw% | Log analysis | Dst | Repeat formation tester (RFT) |
|---|---|---|---|---|---|---|
| Continuous-phase oil | Yes | Yes | <65 for Ss, <45 for Ls or dolomite | Moveable oil | Free oil or oil-cut fluids | Hydrocarbon gradient |
| Residual oil | Yes | Yes | >65 for Ss, >45 for Ls or dolomite | No moveable oil | No recovery | Hydrostatic gradient |
| In-kerogen oil | Yes | No | 100 or less | No moveable oil | No recovery | Hydrostatic gradient |
Gas show type manifestations[edit]
Gas show types are similar to oil show types but need to be considered separately. Use the table below to help with gas show interpretation.
| Show type | Core or cuttings | Mud log | Sw% | Log analysis | Dst | Rft |
|---|---|---|---|---|---|---|
| Continuous-phase gas | Yes | Yes | <65 for Ss, <45 for Ls or dolomite | Moveable gas | Gas to surface at measurable sustained rate | Hydrocarbon gradient |
| Residual gas | Yes | Yes | >65 for Ss, >45 for Ls or dolomite | No moveable gas | Short flow period caused by pressure drop near wellbore | Hydrostatic gradient |
| Dissolved gas | Yes | Yes | 100 | No moveable gas | Gas-cut water or mud | Hydrostatic gradient |
Shows from transition and waste zones[edit]
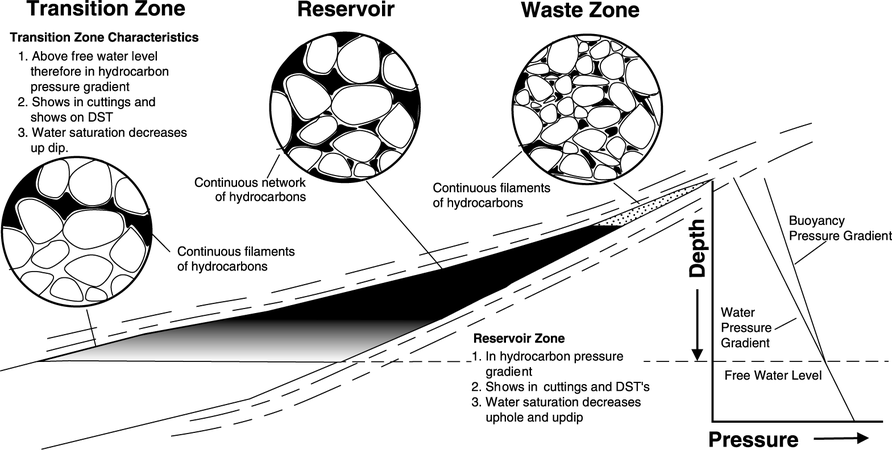
Shows from waste and transition zones are continuous-phase shows. Waste zones occur at the top of traps; transition zones occur at the bottom. The table below lists ways to distinguish transition zone shows from waste zone shows (after Schowalter and Hess[1]).
| Characteristic | Transition | Waste |
|---|---|---|
| Fluid production | Oil or gas with water, or water only | Oil or gas with water, or water only |
| Flow rate | High in high-permeability rocks | Low |
| Water saturation | High, decreases upward | Low, increases upward |
| Calculated hydrocarbon column | Small | Large |
Residual shows[edit]
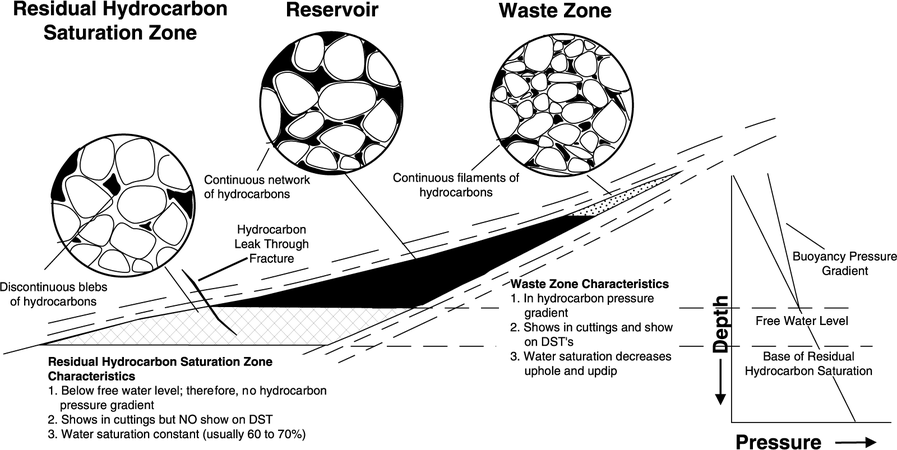
Residual hydrocarbons occur as dead oil or as water displacement residual hydrocarbons. Dead oil forms as a result of water washing, thermal cracking, or biodegradation. Water displacement residual hydrocarbons form in reservoirs as a result of a leaky or breached trap or as a result of production.
Dissolved-gas shows[edit]
Dissolved-gas shows are reported as mud-log shows, trip gas, gas-cut fluids, and gas bubbles in samples. Dissolved-gas shows occur when gas is liberated from water as pressure drops in rock cuttings pores as they rise to the surface during drilling. The amount of gas contained in formation water depends on the salinity. Fresher formation water absorbs more gas. Quantities range up to 14 scf/bbl of water.[2] Dissolved gas has no capacity to flow into a wellbore, and dissolved shows are significant only in that hydrocarbons are present.
In-kerogen shows[edit]
In-kerogen shows occur when solvents are used on cuttings containing kerogen. The solvents liberate some oil from the kerogen, and this oil can be mistaken for evidence of free oil. Kerogen is the precursor to oil or gas and, when heated, generates oil and/or gas. Inkerogen shows indicate the presence of source rocks that have generated oil or gas.
Residual and continuous-phase shows[edit]
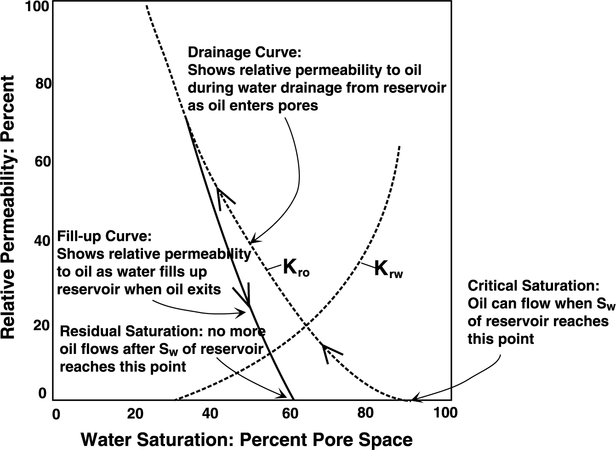
During reservoir water drainage, hydrocarbons enter a trap. The trap starts at 0% hydrocarbon saturation (So), or 100% Sw, and ends up with a higher So. Water refills the reservoir as hydrocarbons exit a trap (fill-up). During fill-up some hydrocarbons are permanently left behind as a residual accumulation. There is no relative permeability to hydrocarbons in rocks containing residual hydrocarbons. At a point during fill-up, hydrocarbons no longer drain because they are no longer connected in a column but are isolated in pores. A DST of a zone with residual hydrocarbons produces no oil or gas, and an RFT would not show a hydrocarbon gradient.
Figure 1 shows drainage and fill-up relative permeability curves for an oil reservoir. In this example, the reservoir ends up with approximately 60% Sw, or 40% residual hydrocarbon saturation.
Trap with transition zone[edit]
Figure 2 is a schematic cross section of a stratigraphic trap with transition, reservoir, and waste zones and their corresponding show characteristics.
Trap with residual hydrocarbon zone[edit]
Figure 3 is a schematic cross section of a stratigraphic trap with residual hydrocarbon saturation, reservoir, and waste zones and their corresponding show characteristics.
See also[edit]
- Interpreting water saturation
- Interpreting Sw distribution in a reservoir
- Predicting hydrocarbon recovery
References[edit]
- ↑ 1.0 1.1 Schowalter, T. T. and P. D. Hess, 1982, Interpretation of subsurface hydrocarbon shows: AAPG Bulletin, vol. 66, p. 723–760.
- ↑ Schowalter, T. T., 1979, Mechanics of secondary hydrocarbon migration and entrapment: AAPG Bulletin, vol. 63, no. 5, p. 723–760.


