Difference between revisions of "East Breaks hydrocarbon generation model"
Cwhitehurst (talk | contribs) m (added Category:Treatise Handbook 3 using HotCat) |
|||
| (16 intermediate revisions by 3 users not shown) | |||
| Line 6: | Line 6: | ||
| part = Critical elements of the petroleum system | | part = Critical elements of the petroleum system | ||
| chapter = Sedimentary basin analysis | | chapter = Sedimentary basin analysis | ||
| − | | frompg = 4- | + | | frompg = 4-98 |
| − | | topg = 4- | + | | topg = 4-99 |
| author = John M. Armentrout | | author = John M. Armentrout | ||
| link = http://archives.datapages.com/data/specpubs/beaumont/ch04/ch04.htm | | link = http://archives.datapages.com/data/specpubs/beaumont/ch04/ch04.htm | ||
| Line 15: | Line 15: | ||
}} | }} | ||
==Method== | ==Method== | ||
| + | <gallery mode=packed heights=200px widths=200px> | ||
| + | file:sedimentary-basin-analysis_fig4-53.png|{{figure number|1}}32-layer, 1-D mathematical model constructed for the East Breaks 160-161 minibasin. After Dow et al.<ref name=ch04r29 /> © Gulf Coast SEPM. | ||
| + | sedimentary-basin-analysis_fig4-42.png|{{figure number|2}}Structural elements that define East Breaks 160-161 minibasin. From Armentrout et al.<ref name=Armentroutetal_1991>Armentrout, J. M., S. J. Malacek, P. Braithwaite, and C. R. Beeman, 1991, Seismic facies of slope basin turbidite reservoirs, East Breaks 160-161 field: Pliocene-Pleistocene, northwestern Gulf of Mexico ''in'' P. Weimer and M. J. Link, eds., Seismic facies and sedimentary processes of submarine fans and turbidite systems: New York, Springer-Verlag, p. 223-239.</ref> Courtesy Springer-Verlag. | ||
| + | file:sedimentary-basin-analysis_fig4-44.png|{{figure number|3}}Schematic diagram of the of the seismic reflection profile along the west side of the East Breaks 160-161 field. From Armentrout and Clement.<ref name=Armentroutandclement_1990>Armentrout, J. M., and J. F. Clement, 1990, Biostratigraphic calibration of depositional cycles: A case study in High Island-Galveston-East Breaks areas, offshore Texas: Proceedings, Gulf Coast Section SEPM 11th Annual Research Conference, p. 21-51.</ref> Courtesy Gulf Coast SEPM. | ||
| + | </gallery> | ||
| − | + | A 32-layer, 1-D mathematical model ([[:file:sedimentary-basin-analysis_fig4-53.png|Figure 1]]) was constructed for the East Breaks 160-161 [[minibasin]]. The No. A-29 well in block 160 was used for stratigraphic and thermal control, including borehole temperature surveys and [[vitrinite reflectance]] data. [[Modeling]] was extended [[depth::3,000 ft]] (1000 m) below true vertical drilling depth (12,000 ft, 4000 m) to evaluate the underlying speculated source potential of the middle and lower Miocene section. The figure is a north-south seismic reflection profile across the East Breaks 160-161 intraslope minibasin (see [[:file:sedimentary-basin-analysis_fig4-42.png|Figure 2]] and [[:file:sedimentary-basin-analysis_fig4-44.png|Figure 3]]). The deviated wellbore of the East Breaks well 160 No. A-29 is marked with a white dashed line. Reservoirs for analyzed oils are indicated for the ''Hyal B'' HB-2 reservoir and for the ''Glob alt'' GA-3 reservoir. Rock cutting samples from intervals indicated by A and B were used by Dow et al.<ref name=ch04r29>Dow, W. G., M. A. Yukler, J. T. Senftle, M. C. Kennicutt, and J. M. Armentrout II, 1990, Miocene oil source beds in the East Breaks basin, Flex-Trend, offshore Texas: Proceedings, Gulf Coast Section SEPM 9th Annual Research conference, p. 139–150.</ref> to calibrate [[kerogen]] type for kinetic [[modeling]]. | |
| − | |||
| − | A 32-layer, 1-D mathematical model ([[:file:sedimentary-basin-analysis_fig4-53.png|Figure 1]]) was constructed for the East Breaks 160-161 minibasin. The No. A-29 well in block 160 was used for stratigraphic and thermal control, including borehole temperature surveys and [[vitrinite reflectance]] data. [[Modeling]] was extended [[depth::3,000 ft]] (1000 m) below true vertical drilling depth (12,000 ft, 4000 m) to evaluate the underlying speculated source potential of the middle and lower Miocene section. The figure is a north-south seismic reflection profile across the East Breaks 160-161 intraslope minibasin (see | ||
==Generation and expulsion timing== | ==Generation and expulsion timing== | ||
| − | + | A [[Burial history chart|burial history plot]] with computed [[Petroleum generation|hydrocarbon generation]] history shows that peak oil generation in the A-29 well began at the inferred base of the lower Miocene when buried below [[depth::11,000 ft]] (3000 m) about 1.2 Ma, at the base of the inferred middle Miocene when it too passed below [[depth::11,000 ft]] (3000 m) burial about 0.2 Ma. | |
| − | Miocene source beds, if present, would be actively generating and expelling oil and gas at the present time. Dow et al.<ref name=ch04r29 /> interpret this to account for the biodegraded East Breaks 160-161 field oils being recharged with fresh oil during a later [[migration]] phase. The relatively low maturity of the inferred Miocene section should also result in only minor thermogenic gas generation and might explain the absence of evaporative fractionation in the produced crudes of this field in contrast to approximately 75% of Gulf Coast Tertiary crudes<ref name=ch04r96>Thompson, K. F. M., M. C. Kennicutt, and J. M. Brooks II, 1990, [http://archives.datapages.com/data/bulletns/1990-91/data/pg/0074/0002/0000/0187.htm Classification of offshore Gulf of Mexico oils and gas condensates]: AAPG Bulletin, vol. 74, p. 187–198.</ref> | + | Miocene source beds, if present, would be actively generating and expelling oil and gas at the present time. Dow et al.<ref name=ch04r29 /> interpret this to account for the [http://www.oiltracers.com/services/exploration-geochemistry/oil-biodegradation.aspx biodegraded] East Breaks 160-161 field oils being recharged with fresh oil during a later [[migration]] phase. The relatively low maturity of the inferred Miocene section should also result in only minor thermogenic gas generation and might explain the absence of evaporative fractionation in the produced crudes of this field in contrast to approximately 75% of Gulf Coast [[Tertiary]] crudes.<ref name=ch04r96>Thompson, K. F. M., M. C. Kennicutt, and J. M. Brooks II, 1990, [http://archives.datapages.com/data/bulletns/1990-91/data/pg/0074/0002/0000/0187.htm Classification of offshore Gulf of Mexico oils and gas condensates]: AAPG Bulletin, vol. 74, p. 187–198.</ref> |
==Burial history== | ==Burial history== | ||
| − | The following figure is a 1-D burial history | + | The following figure is a 1-D [[Burial history chart|burial history]] or [[maturation]] plot showing the critical moment (2.0 Ma) and the time of oil generation (2.0 Ma to present) for the East Breaks 160-161 minibasin [[petroleum system]], assuming that lower Miocene rocks have sourced the hydrocarbons. Alternative burial history plots could be constructed using the assumed burial depths for each potential source horizon. For these deeply buried potential source horizons, generation must have been delayed until very recently or secondary migration from older, deeper reservoirs provides the hydrocarbons trapped at the East Breaks 160-161 field. Additionally, basins are 3-D entities, and either 2-D models throughout the basin or a 3-D model of the entire basin is essential to understanding the maturation history of a basin. |
==See also== | ==See also== | ||
| Line 47: | Line 50: | ||
[[Category:Sedimentary basin analysis]] | [[Category:Sedimentary basin analysis]] | ||
[[Category:East Breaks]] | [[Category:East Breaks]] | ||
| + | [[Category:Treatise Handbook 3]] | ||
Latest revision as of 15:33, 23 March 2022
| Exploring for Oil and Gas Traps | |

| |
| Series | Treatise in Petroleum Geology |
|---|---|
| Part | Critical elements of the petroleum system |
| Chapter | Sedimentary basin analysis |
| Author | John M. Armentrout |
| Link | Web page |
| Store | AAPG Store |
Method
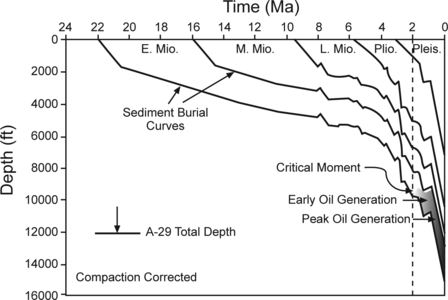
Figure 1 32-layer, 1-D mathematical model constructed for the East Breaks 160-161 minibasin. After Dow et al.[1] © Gulf Coast SEPM.
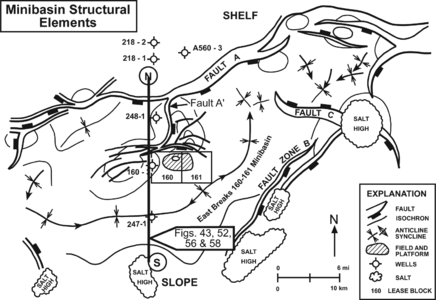
Figure 2 Structural elements that define East Breaks 160-161 minibasin. From Armentrout et al.[2] Courtesy Springer-Verlag.
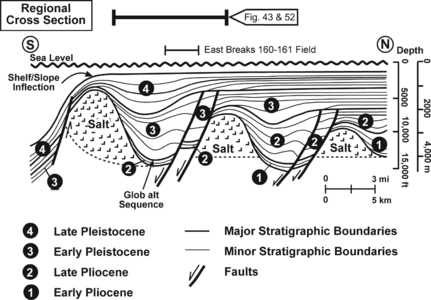
Figure 3 Schematic diagram of the of the seismic reflection profile along the west side of the East Breaks 160-161 field. From Armentrout and Clement.[3] Courtesy Gulf Coast SEPM.


A 32-layer, 1-D mathematical model (Figure 1) was constructed for the East Breaks 160-161 minibasin. The No. A-29 well in block 160 was used for stratigraphic and thermal control, including borehole temperature surveys and vitrinite reflectance data. Modeling was extended depth::3,000 ft (1000 m) below true vertical drilling depth (12,000 ft, 4000 m) to evaluate the underlying speculated source potential of the middle and lower Miocene section. The figure is a north-south seismic reflection profile across the East Breaks 160-161 intraslope minibasin (see Figure 2 and Figure 3). The deviated wellbore of the East Breaks well 160 No. A-29 is marked with a white dashed line. Reservoirs for analyzed oils are indicated for the Hyal B HB-2 reservoir and for the Glob alt GA-3 reservoir. Rock cutting samples from intervals indicated by A and B were used by Dow et al.[1] to calibrate kerogen type for kinetic modeling.
Generation and expulsion timing
A burial history plot with computed hydrocarbon generation history shows that peak oil generation in the A-29 well began at the inferred base of the lower Miocene when buried below depth::11,000 ft (3000 m) about 1.2 Ma, at the base of the inferred middle Miocene when it too passed below depth::11,000 ft (3000 m) burial about 0.2 Ma.
Miocene source beds, if present, would be actively generating and expelling oil and gas at the present time. Dow et al.[1] interpret this to account for the biodegraded East Breaks 160-161 field oils being recharged with fresh oil during a later migration phase. The relatively low maturity of the inferred Miocene section should also result in only minor thermogenic gas generation and might explain the absence of evaporative fractionation in the produced crudes of this field in contrast to approximately 75% of Gulf Coast Tertiary crudes.[4]
Burial history
The following figure is a 1-D burial history or maturation plot showing the critical moment (2.0 Ma) and the time of oil generation (2.0 Ma to present) for the East Breaks 160-161 minibasin petroleum system, assuming that lower Miocene rocks have sourced the hydrocarbons. Alternative burial history plots could be constructed using the assumed burial depths for each potential source horizon. For these deeply buried potential source horizons, generation must have been delayed until very recently or secondary migration from older, deeper reservoirs provides the hydrocarbons trapped at the East Breaks 160-161 field. Additionally, basins are 3-D entities, and either 2-D models throughout the basin or a 3-D model of the entire basin is essential to understanding the maturation history of a basin.
See also
- East Breaks petroleum system
- East Breaks trap formation
- East Breaks geochemistry
- East Breaks hydrocarbon migration model
- East Breaks hydrocarbon accumulation model
- East Breaks critical moment
References
- ↑ 1.0 1.1 1.2 Dow, W. G., M. A. Yukler, J. T. Senftle, M. C. Kennicutt, and J. M. Armentrout II, 1990, Miocene oil source beds in the East Breaks basin, Flex-Trend, offshore Texas: Proceedings, Gulf Coast Section SEPM 9th Annual Research conference, p. 139–150.
- ↑ Armentrout, J. M., S. J. Malacek, P. Braithwaite, and C. R. Beeman, 1991, Seismic facies of slope basin turbidite reservoirs, East Breaks 160-161 field: Pliocene-Pleistocene, northwestern Gulf of Mexico in P. Weimer and M. J. Link, eds., Seismic facies and sedimentary processes of submarine fans and turbidite systems: New York, Springer-Verlag, p. 223-239.
- ↑ Armentrout, J. M., and J. F. Clement, 1990, Biostratigraphic calibration of depositional cycles: A case study in High Island-Galveston-East Breaks areas, offshore Texas: Proceedings, Gulf Coast Section SEPM 11th Annual Research Conference, p. 21-51.
- ↑ Thompson, K. F. M., M. C. Kennicutt, and J. M. Brooks II, 1990, Classification of offshore Gulf of Mexico oils and gas condensates: AAPG Bulletin, vol. 74, p. 187–198.
External links
| find literature about East Breaks hydrocarbon generation model |