Difference between revisions of "Seismic facies mapping"
Jump to navigation
Jump to search
Cwhitehurst (talk | contribs) |
Cwhitehurst (talk | contribs) |
||
| Line 33: | Line 33: | ||
==Example== | ==Example== | ||
| − | [[file:exploring-for-stratigraphic-traps_fig21-28.png|300px|thumb|{{figure number|1}}Examples of a seismic facies map, an isochron map, and seismic line A–Á (location shown on maps). Modified from Mitchum and Vail, 1977 | + | [[file:exploring-for-stratigraphic-traps_fig21-28.png|300px|thumb|{{figure number|1}}Examples of a seismic facies map, an isochron map, and seismic line A–Á (location shown on maps). Modified from Mitchum and Vail;<ref> |
| + | Mitchum, R. M., P. R. Vail, and J. B. Sangree, 1977, [http://archives.datapages.com/data/specpubs/seismic1/data/a165/a165/0001/0100/0117.htm Seismic stratigraphy and global changes in sea level, part 6: Stratigraphic interpretations of seismic reflection patterns in depositional sequences], in C. E. Payton, ed., Seismic Stratigraphy and Applications to Hydrocarbon Exploration: [http://store.aapg.org/detail.aspx?id=1157 AAPG Memoir 26], p. 117–133.</ref> courtesy AAPG.]] | ||
[[:file:exploring-for-stratigraphic-traps_fig21-28.png|Figure 1]] contains examples of a seismic facies map, an [[isochron]] map, and seismic line A–Á (location shown on maps). | [[:file:exploring-for-stratigraphic-traps_fig21-28.png|Figure 1]] contains examples of a seismic facies map, an [[isochron]] map, and seismic line A–Á (location shown on maps). | ||
| Line 45: | Line 46: | ||
* [[Analyzing lithofacies]] | * [[Analyzing lithofacies]] | ||
* [[Petrophysical analysis of lithofacies]] | * [[Petrophysical analysis of lithofacies]] | ||
| + | |||
| + | ==References== | ||
| + | {{reflist}} | ||
==External links== | ==External links== | ||
Revision as of 21:12, 8 September 2014
| Exploring for Oil and Gas Traps | |

| |
| Series | Treatise in Petroleum Geology |
|---|---|
| Part | Predicting the occurrence of oil and gas traps |
| Chapter | Exploring for stratigraphic traps |
| Author | John C. Dolson, Mike S. Bahorich, Rick C. Tobin, Edward A. Beaumont, Louis J. Terlikoski, Michael L. Hendricks |
| Link | Web page |
| Store | AAPG Store |
Seismic facies maps show the areal distribution of seismic facies and are useful when making lithofacies interpretations. The most common and useful parameters to be mapped are seismic reflection patterns and isochrons (thickness measured in seconds of two-way time).
Procedure
The table below outlines a suggested procedure for mapping seismic facies.
| Step | Action |
|---|---|
| 1 | Identify sequences that contain potential traps, seal rocks, reservoir rocks, or source rocks. |
| 2 | Make regional seismic reflection pattern maps and isochron maps of those sequences. If possible, make maps of lowstand, transgressive, and highstand systems tracts. |
Example

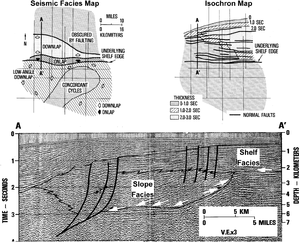
Figure 1 Examples of a seismic facies map, an isochron map, and seismic line A–Á (location shown on maps). Modified from Mitchum and Vail;[1] courtesy AAPG.
Figure 1 contains examples of a seismic facies map, an isochron map, and seismic line A–Á (location shown on maps).
See also
- Seismic facies analysis
- Basics of seismic facies analysis
- Reflection configuration patterns
- Analyzing individual reflectors
- Techniques for enhancing seismic facies analysis
- Analyzing lithofacies
- Petrophysical analysis of lithofacies
References
- ↑ Mitchum, R. M., P. R. Vail, and J. B. Sangree, 1977, Seismic stratigraphy and global changes in sea level, part 6: Stratigraphic interpretations of seismic reflection patterns in depositional sequences, in C. E. Payton, ed., Seismic Stratigraphy and Applications to Hydrocarbon Exploration: AAPG Memoir 26, p. 117–133.
External links
| find literature about Seismic facies mapping |