Difference between revisions of "Hydrogen Index (HI)"
Jump to navigation
Jump to search
FWhitehurst (talk | contribs) |
FWhitehurst (talk | contribs) |
||
| Line 22: | Line 22: | ||
==How to apply HI== | ==How to apply HI== | ||
| − | Hydrocarbon generation | + | [[Hydrocarbon generation zone]]s can be indicated in the HI data for a uniform source section when HI decreases with depth. Inconsistencies due to changes in organic facies or the chemistry of the [[source rock]] can produce shifts in the HI data which are not indicative of [[maturation]] trends. Therefore, be sure the source is of uniform character when applying this concept. |
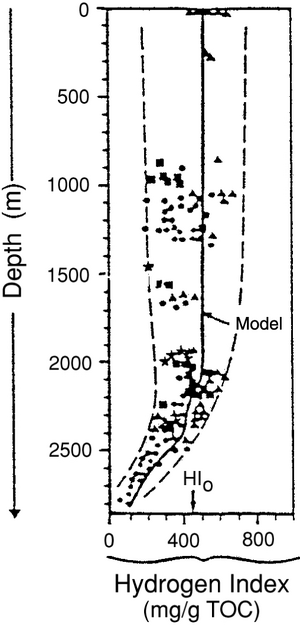
[[:file:evaluating-source-rocks_fig6-14.png|Figure 1]] shows a decreasing HI trend for a source rock beginning to generate hydrocarbons at a depth of approximately [[depth::2200 m]]. | [[:file:evaluating-source-rocks_fig6-14.png|Figure 1]] shows a decreasing HI trend for a source rock beginning to generate hydrocarbons at a depth of approximately [[depth::2200 m]]. | ||
Revision as of 21:09, 29 April 2014
| Exploring for Oil and Gas Traps | |

| |
| Series | Treatise in Petroleum Geology |
|---|---|
| Part | Critical elements of the petroleum system |
| Chapter | Evaluating source rocks |
| Author | Carol A. Law |
| Link | Web page |
| Store | AAPG Store |
Gross trends of hydrogen indices (HIs) can be used as a maturation indicator. The hydrogen index is calculated from Rock-Eval data using the following formula:
How to apply HI
Hydrocarbon generation zones can be indicated in the HI data for a uniform source section when HI decreases with depth. Inconsistencies due to changes in organic facies or the chemistry of the source rock can produce shifts in the HI data which are not indicative of maturation trends. Therefore, be sure the source is of uniform character when applying this concept.
Figure 1 shows a decreasing HI trend for a source rock beginning to generate hydrocarbons at a depth of approximately depth::2200 m.
See also
- Evaluating source rock maturity
- Maturation
- Tmax
- Vitrinite reflectance
- Apatite fission track analysis
- Spore coloration and thermal alteration indices
- Production Index (PI)

