Search results
Jump to navigation
Jump to search
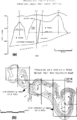
File:Subsurface-maps fig4.png (a) Cross section and (b) net pay Isopach map of the Strachan gas field, western Canada. Contour Interval is 100 ft. (Fro(890 × 1,386 (78 KB)) - 20:42, 14 January 2014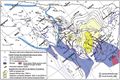
File:M106Ch14Fig13.jpg ...of the Arab reservoir before the Zagros folding, together with the isopach map of the Hanifa–Tuwaiq Mountain and Diyab source rocks (TOC in excess of 1%(700 × 464 (101 KB)) - 18:44, 12 July 2016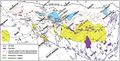
File:M106Ch14Fig12.jpg Cumulative isopach map from the base of the Kazhdumi Formation (Albian) to the top of the Mishan F(700 × 356 (74 KB)) - 19:40, 12 July 2016
File:M106Ch07Fig04.jpg Isopach map of organic-rich Silurian shales with total gamma-ray values exceeding 150 A(564 × 855 (75 KB)) - 20:49, 18 April 2016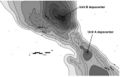
File:Mth14ch02f07.jpg Gross-sandstone isopach map of the Yowlumne sandstone showing separate depocenter thicks in Units A and(700 × 449 (53 KB)) - 19:56, 4 December 2015- Follow these suggested steps to map unconformities for prospects. # Map subcrop and supercrop lithology and formations.7 KB (977 words) - 20:39, 4 February 2022
- [[file:sedimentary-basin-analysis_fig4-12.png|thumb|400px|{{figure number|1}}Map of the drainage basin of the modern Mississippi River, illustrating the net [[:file:sedimentary-basin-analysis_fig4-12.png|Figure 1]] is a map of the drainage basin of the modern Mississippi River, illustrating the net6 KB (811 words) - 16:50, 22 February 2022
- * A structure [[contour]] map on top of the reservoir. * An [[Subsurface_maps#Isopach|isopach map]] of the target reservoir—especially important if the reservoir displays4 KB (504 words) - 14:17, 2 February 2022
- [[file:FG11.JPG|thumb|400px|Facies map depicting Middle Jurassic paleogeography. 1 = deep-water deposits of the Lo ...S., 1984, Exploration Stratigraphy: Tulsa, PennWell Books, 334 p.</ref> We map [[reservoir system]] thickness (1) to compare the distribution of reservoir15 KB (2,070 words) - 20:34, 7 July 2016
- Mapping age-specific isopach thicks in the northern GOM basin defines laterally shifting sites of maximu file:sedimentary-basin-analysis_fig4-6.png|{{figure number|2}}Tectonic map of the GOM basin. Modified from Buffler;<ref name=Buffler1991>Buffler, R. T11 KB (1,496 words) - 18:17, 22 February 2022
- ...icular area which includes rocks units and its structures. From geological map, we can obtain type of rocks, thickness, lithologies bearings (strike and d ==History of Geological Map==10 KB (1,654 words) - 06:11, 30 June 2015
- ...icular area which includes rocks units and its structures. From geological map, we can obtain type of rocks, thickness, lithologies bearings (strike and d ==History of Geological Map==10 KB (1,633 words) - 05:38, 30 June 2015
- ...icular area which includes rocks units and its structures. From geological map, we can obtain type of rocks, thickness, lithological bearings ([[strike]] ...distribution of rocks on a topographic map. The idea of making an original map of rock distribution was invented in 1684 by [[w:Martin Lister | Martin Lis10 KB (1,547 words) - 14:07, 19 March 2019
- ...mmending lease purchases Recommending drilling a test well on the basis of map interpretation * A simple gross sand [[Subsurface maps#Isopach|isopach]] map that is essentially unaltered by results of considerable additional drillin6 KB (808 words) - 15:30, 18 February 2022
- Sedimentary-basin-analysis fig4-5.png|{{figure number|3}}Map of hydrocarbon types ibased on analyses of more than 2000 oil, 600 gas, and A map of the sediment thickness (isopach) and occurrence of hydrocarbons is an initial step in identifying the [[pet5 KB (753 words) - 19:58, 18 February 2022
- A paleogeography map of a [[reservoir]] interval, reservoir thickness, and fields (producing fro # Plot paleogeography, reservoir thickness, and field location on the same map.11 KB (1,482 words) - 15:47, 21 March 2022
- [[file:subsurface-maps_fig1.png|300px|thumb|{{figure number|1}}Structure map of the top of the T5 marker, Frlo Formation, Brazoria County, Texas. (After ...es for some reservoirs, and sufficient well control might exist to contour map the fault surface itself. Projections of subsurface data into the plane of22 KB (3,076 words) - 13:56, 24 January 2022
- ...hole tools|well logs]], [[Seismic data - creating an integrated structure map|2-D and 3-D seismic images]] (in both time and depth), [[Gravity basics|gra ...hole tools|well]] and/or [[Seismic data - creating an integrated structure map|seismic data]]. The number of horizons depends on the quality of the data a18 KB (2,422 words) - 14:21, 2 February 2022
- ...ach map of the highstand systems tract. Test and show data overlain on the map show that significant reservoirs are restricted generally in the ''Ivanovia8 KB (1,184 words) - 20:44, 4 February 2022
- file:Mth14ch02f01.jpg|{{figure number|1}}Structure map of Yowlumne field drawn on the N-point marker, a regional correlation horiz file:Mth14ch02f05.jpg|{{figure number|5}} Map with cross sections X-Z and Y-Z showing basinward-stepping geometries exhib13 KB (1,896 words) - 19:02, 11 March 2019


