Migration pathway
| Exploring for Oil and Gas Traps | |

| |
| Series | Treatise in Petroleum Geology |
|---|---|
| Part | Critical elements of the petroleum system |
| Chapter | Migration of petroleum |
| Author | Martin D. Matthews |
| Link | Web page |
| Store | AAPG Store |
Hydrocarbon migration appears to occur in spatially limited areas (always unsampled because of their small size) and in discrete time intervals. It leaves either no trace or a trace that is continually modified or destroyed by later events. Effective hydrocarbon migration occurs along discrete pathways, not along broad, uniform fronts. These pathways are determined by the pore networks, the interaction of these networks between formations, and the stratigraphic variation within the basin. Within the carrier/reservoir bed, the migration pathway is controlled by the structural configuration of the contact with the overlying seal and the continuity of both the carrier permeability network and the overlying seal.
The general flow of petroleum from a mature source rock to a trap can be estimated using a few simple assumptions:
- The dominant force causing petroleum to move is buoyancy.
- Petroleum is deflected laterally through sand-rich sections by overlying shale-rich sections.
- Where there are closed traps along this pathway, petroleum will accumulate until the trap is full and spills, or leaks, any additional migrating petroleum.
The exact flow paths generally require more detailed information about stratigraphic variability, distribution of fractures, and permeability of faults than is generally available to geologists.
Procedure
The table below lists a procedure for defining migration pathways.
- Identify stratigraphic units with high permeability that could serve as carrier beds.
- Identify stratigraphic units with low permeability that could serve as regional seals.
- Make a structure contour map at the top of carrier beds or the base of regional seal. Highs focus flow; lows diffuse flow.
- Locate source rocks and map the location of the upper boundary of the oil and gas maturation windows.
- Locate other geologic features that could influence flow pathways, e.g., fault segments, fractures,unconformities, boundaries of intrusions, flanks of salt domes.
- Draw migration vectors based on the above information.
Data requirements
A map of the structure at the top of the main sand-rich section is required to make a petroleum migration map. Generally, a map showing the present structure is used. However, a much better result can be obtained by using a map showing the structure at the time of main hydrocarbon expulsion. The location of mature source rock is projected vertically onto this map.
Constructing a map
The area of the mature source forms the boundary from which petroleum is considered to migrate. Flow lines showing the expected direction of hydrocarbon migration are constructed on this map using the assumption that migration flow is perpendicular to structural contour lines and moves updip. All closures should be considered as the end of the migration path unless there is a good reason why the trap should spill hydrocarbons. Faults can be considered as either nonsealing (the flow lines go updip right through them) or sealing (they divert the flow of hydrocarbons around them).
Influence of regional seals
The map described above assumes petroleum expelled from the source rock migrates vertically until it reaches a single regionally continuous seal and then migrates laterally into traps, or that any immediate seals have the same structure as the regional seal. Although the latter assumption is often justified, it sometimes may be necessary to make drainage maps on intermediate regional seals and assume the petroleum from the source rock migrates vertically to the first regional seal above it and is deflected laterally as shown by the flow lines interpreted on the base of that seal. At the limit of that seal or at holes in that seal, the petroleum is assumed to migrate vertically until it once again becomes constrained by a seal. In this way, the petroleum is seen to stairstep up the section. It migrates below intermediate regional seals and possibly fills intermediate traps until it is finally constrained below a master sealing section, if one is present.
Example

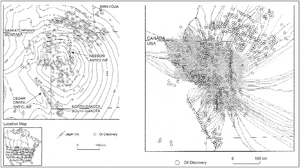
Figure 1 is an example of defining migration pathways in the Williston basin. Part A is a structure map at the base of the principal source rock, the Bakken Formation. This simplified map is a reasonable representation of the structural configuration for the basin. Part B shows migration pathways from the Bakken, based on the basin structural configuration only; hydrodynamic effects are not included.
See also
- Migration
- Formation-scale migration pathways
- Defining migration pathways from source to trap
- Migration distance: vertical and lateral
- Migration rate
- Migration by separate phase
- Migration by solution in water
References
- ↑ Hindle, A. D., 1997, Petroleum migration pathways and charge concentration: a three dimensional model: AAPG Bulletin, vol. 81, p. 1451–1481.