Morrow lithofacies and pore types: Sorrento field
| Exploring for Oil and Gas Traps | |

| |
| Series | Treatise in Petroleum Geology |
|---|---|
| Part | Predicting the occurrence of oil and gas traps |
| Chapter | Predicting reservoir system quality and performance |
| Author | Dan J. Hartmann, Edward A. Beaumont |
| Link | Web page |
| Store | AAPG Store |
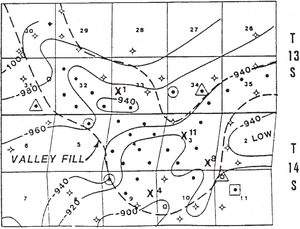
By studying core and log data from one well (well 11; see Figure 1), we see a picture of a clastic reservoir with wide heterogeneity in total [[Porosity|porosities], pore-throat sizes, and capillary pressures. In addition, the depositional environment of these sandstones (fluvial valley fill) indicates they probably have limited lateral continuity within the valley-fill complex.

Reservoir lithologic description
Morrow sandstones in the Sorrento field are slightly shaly, range in grain size from very coarse to fine, and are poorly sorted. As a consequence, pores and pore throats also have wide ranges in size. Hand-sample petrography indicates the dominant porosity is intergranular microporosity to megaporosity. Clay crystals create minor intercrystalline microporosity in larger pores. Moldic (cement solution?) porosity also may be present but is minor. (For definitions of porosity types, see Reservoir quality.)
Reservoir porosity and permeability

Morrow sandstones in Sorrento field have a wide range in porosity and permeability. Maximum observed porosity (Φ) is 20-22%, but more typical values are 10-15%. Air permeabilities (Ka) are as great as 1-2 darcies but more commonly are 200-500 md.
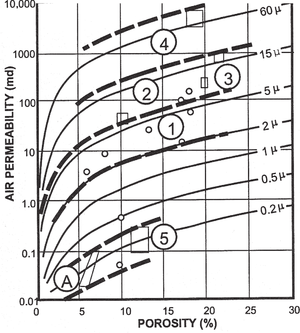
Figure 2 is a Ka/Φ crossplot for well 11. Dots and polygons represent measured Ka/Φ values. Curves are the graphical solution of Winland's r35 equation[3] and represent equal r35 values (port size).
The crossplot shows a large variation in port size for the samples from well 11. Areas between dashed lines group points into beds with similar port size, or flow units.
Extrapolated capillary pressure curves and pore types

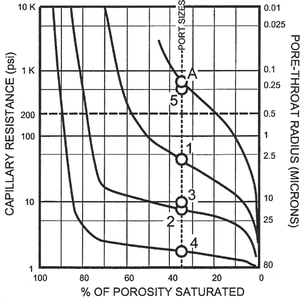
No capillary pressure measurements were available for this study. They were estimated-by plotting r35 values on a semilog crossplot of fluid saturation vs. capillary pressure. A capillary pressure curve for each sample passes through its correlative r35 value. Calculations of r35 for well 11 indicate a large variety of capillary pressures and pore types. Pore types for the Morrow samples from this well are mega, macro, and micro.
The numbers on the curves in Figure 3 correspond to the numbers on the Ka/Φ crossplot on Figure 9-86. Minimum water saturations (“immobile” water) estimated from log calculations let us extrapolate the Pc curves into low Sw ranges.
See also
- Evaluation of saturation profiles
- Setting and structure of the Sorrento field
- Sorrento water saturation calculations
- Petrophysical analysis of Sorrento field wells
- Water saturation profile for Sorrento field
References
- ↑ Sonnenberg, S. A., 1985, Tectonic and sedimentation model for Morrow sandstone deposition, Sorrento field area, Denver basin, Colorado: The Mountain Geologist, October, p. 180-191.
- ↑ 2.0 2.1 Hartmann, D. J., and E. B. Coalson, 1990, Evaluation of the Morrow sandstone in Sorrento field, Cheyenne County, Colorado, in S. A. Sonnenberg, L. T. Shannon, K. Rader, W. F. von Drehle, and G.W. Martin, eds., Morrow Sandstones of Southeast Colorado and Adjacent Areas: RMAG Symposium, p. 91-100.
- ↑ Pittman, E. D., 1992, Relationship of porosity to permeability to various parameters derived from mercury injection–capillary pressure curves for sandstone: AAPG Bulletin, vol. 76, no. 2, p. 191–198.