Rock quality
| Exploring for Oil and Gas Traps | |

| |
| Series | Treatise in Petroleum Geology |
|---|---|
| Part | Predicting the occurrence of oil and gas traps |
| Chapter | Predicting reservoir system quality and performance |
| Author | Dan J. Hartmann, Edward A. Beaumont |
| Link | Web page |
| Store | AAPG Store |
Methods
Analyzing air permeability (Ka and porosity (Φ) data separately to characterize rock quality can be deceiving. Analyzing Ka and Φ data using the Ka/Φ ratio or the r35 method[1] is much more effective for determining quality. The Ka/Φ ratio or the r35 method yields information about the fluid flow and storage quality of a rock.
Which is better rock?

Using Ka and Φ data separately to characterize reservoir rock quality is misleading. Consider the rocks shown in the SEM microphotographs in Figure 1. Flow unit 1 is a mesoporous, sucrosic dolomite. Its average Φ is 30% and average Ka is 10 md. Flow unit 2 is a macroporous, oolitic limestone. Its average Φ is 10% and average Ka is 10 md.
Initially, we might think that flow unit 1 is higher quality because it has three times more porosity and the same permeability as flow unit 2. However, in terms of fluid flow efficiency and storage, as shown by the Ka/Φ ratio or r35, flow unit 2 is actually the better rock.
In a reservoir section, increasing Φ and constant Ka indicate pores are becoming more numerous and smaller and pore surface area is increasing. Immobile water saturation for a reservoir (Sw) becomes greater as more surface is available to the wetting fluid. Higher immobile Sw decreases the available pore storage space for hydrocarbons. Also, as the pore size decreases, so does the pore throat size. Flow unit 2 above is the better reservoir rock because it has larger pore throats and lower immobile Sw. Ka/Φ ratio or r35 accounts for the interrelationship of Ka and Φ, making them effective methods for comparing rock quality.
What is the ka/Φ ratio?
Ka and Φ are standard components of many reservoir engineering wellbore flow performance equations. The Ka/Φ ratio reflects rock quality in terms of flow efficiency of a reservoir sample. When clastics and carbonates are deposited, they have a close correlation of particle size to the Ka/Φ ratio. Mean pore throat radius increases as grain or crystal size increases, but modification to grain shape and size tends to “smear” the distribution.
In Figure 1, flow unit 1 has a Ka/Φ value of 33 and flow unit 2 has a Ka/Φ value of 100. Even though Φ is greater and Ka is the same for flow unit 1, the lower Ka/Φ value indicates its quality is lower than flow unit 2.
Ka/Φ plot

On the plot in Figure 2, the contours represent a constant Ka/Φ ratio and divide the plot into areas of similar pore types. Data points that plot along a constant ratio have similar flow quality across a large range of porosity and/or permeability. The clusters of points on the plot in Figure 2 represent hypothetical Ka/Φ values for flow units 1 and 2 presented in Figure 1. The position of the clusters relative to the Ka/Φ contours indicates flow unit 2 has higher quality in terms of Ka/Φ ratio than flow unit 1.
What is r35?

H.D. Winland of Amoco used mercury injection-capillary pressure curves to develop an empirical relationship among Φ, Ka, and pore throat radius (r). He tested 312 different water-wet samples. The data set included 82 samples (56 sandstone and 26 carbonate) with low permeability corrected for gas slippage and 240 other uncorrected samples. Winland found that the effective pore system that dominates flow through a rock corresponds to a mercury saturation of 35%. That pore system has pore throat radii (called port size, or r35) equal to or smaller than the pore throats entered when a rock is saturated 35% with a nonwetting phase. After 35% of the pore system fills with a non-wetting phase fluid, the remaining pore system does not contribute to flow. Instead, it contributes to storage.
Pittman[1] speculates, “Perhaps Winland found the best correlation to be r35 because that is where the average modal pore aperture occurs and where the pore network is developed to the point of serving as an effective pore system that dominates flow.” The capillary pressure curve and pore throat size histogram in Figure 3 illustrate Pittman's point.
The Winland r35 equation
Winland[3][4] developed the following equation to calculate r35 for samples with intergranular or intercrystalline porosity:

where:
- Ka = air permeability, md
- Φ = porosity, % (not decimals)
Solving for r:

Characterizing rock quality with r35

Rock quality is easily characterized using r35. Consider the clusters of points representing flow units 1 and 2 (Figure 1) on the Ka/Φ plot in Figure 4. The diagonal curved lines represent equal r35 values. Points plotting along the same lines represent rocks with similar r35 values and have similar quality. By interpolation, r35 for flow unit 1 is approximately 1.1μ, and r35 for flow unit 2 is approximately 3μ. The r35 in flow unit 2 is almost three times as large as flow unit 1. Therefore, flow unit 2 has better flow quality.
Advantages of r35 over ka/Φ ratio
Using r35 instead of the Ka/Φ ratio for characterizing rock quality of water-wet rocks has advantages:
- r35 is an understandable number; Ka/Φ ratio is a dimensionless number
- r35 can be determined from capillary pressure analysis and related to Ka/Φ values
- If two variables are known (Ka, Φ, or r35), then the other variable can be calculated using Winland's equation or estimated from a Ka/Φ plot with r35 contours
Example capillary pressure curves

Figure 5 Hypothetical capillary pressure curves.
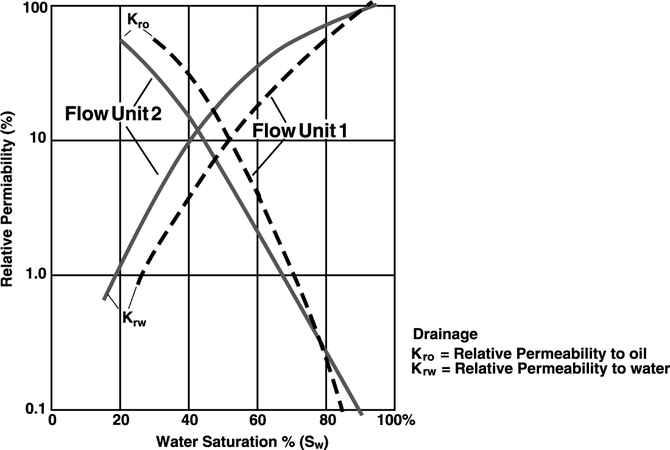
Figure 6 Hypothetical drainage relative permeability curves.


Hypothetical capillary pressure curves can be drawn by using r35 as a point on the curve. The capillary pressure curves below are hypothetical curves for the example presented in Figure 4. The curves demonstrate that entry pressures for flow unit 2 are less than those for flow unit 1; therefore, fluid flow in flow unit 2 is more efficient. In Figure 5, it takes length::28 ft of oil column for oil to enter 35% of pore space of flow unit 2 and length::70 ft to enter 35% of pore space of flow unit 1.
Example relative permeability curves
Figure 6 depicts hypothetical drainage relative permeability curves to represent flow units 1 and 2.
See also
- Pore-fluid interaction
- Hydrocarbon expulsion, migration, and accumulation
- Pc curves and saturation profiles
- Converting Pc curves to buoyancy, height, and pore throat radius
- What is permeability?
- Relative permeability and pore type
References
- ↑ 1.0 1.1 Pittman, E., D., 1992, Relationship of porosity to permeability to various parameters derived from mercury injection–capillary pressure curves for sandstone: AAPG Bulletin, vol. 76, no. 2, p. 191–198.
- ↑ Doveton, J., H., 1995, Wireline Petrofacies Analysis: Notes from short course presented in Calgary, Alberta, April 24–28, 176 p.
- ↑ Winland, H., D., 1972, Oil accumulation in response to pore size changes, Weyburn field, Saskatchewan: Amoco Production Company Report F72-G-25, 20 p. (unpublished).
- ↑ Winland, H., D., 1976, Evaluation of gas slippage and pore aperture size in carbonate and sandstone reservoirs: Amoco Production Company Report F76-G-5, 25 p. (unpublished).
External links
| find literature about Rock quality |