Sandstone permeability estimation from cuttings
| Exploring for Oil and Gas Traps | |

| |
| Series | Treatise in Petroleum Geology |
|---|---|
| Part | Predicting the occurrence of oil and gas traps |
| Chapter | Predicting reservoir system quality and performance |
| Author | Dan J. Hartmann, Edward A. Beaumont |
| Link | Web page |
| Store | AAPG Store |
Sneider and King[1] developed a cuttings-based method of permeability estimation. Where cuttings are available, permeability estimates can be made by examining the surfaces of cuttings for petrophysical permeability indicators. Estimates of the permeability for a particular formation can be extended into areas without data in order to predict permeability.
Basis
Sneider and others at Shell Oil Company developed a methodology for estimating permeability from cuttings by calibrating permeability measured from cores with rock-pore parameters described in cuttings. Cores of known permeability were ground up until chips from the core were the size of cuttings. By using comparators made from core chips, they estimated formation permeability from cuttings with surprising accuracy. Although Sneider and King[1] describe the method for estimating sandstone permeability from cuttings (presented below), procedures could just as easily be developed to predict permeability of carbonates from cuttings.
Petrophysical description
From examination of cuttings, sandstone permeability can be predicted using the following petrophysical descriptions:
- Grain size and sorting
- Degree of rock consolidation
- Volume percent of clays
- Pore sizes and pore interconnections
- Size and distribution of pore throats
Sneider's pore classification for clastics
Sneider and King[1] developed a simple method of classifying pore types from cuttings. The classification of clastic rock pore types from cuttings is made by comparing pore types with production tests and log analysis. The pore types are as follows:
| Type | Description |
|---|---|
| I | Rocks with pores capable of producing gas without natural or artificial fracturing. |
| II | Rocks with pores capable of producing gas with natural or artificial fracturing and/or interbedded with type I rocks. |
| III | Rocks too tight to produce at commercial rates even with natural or artificial fracturing. |
The table below lists the characteristics of pore types I, II, and III.
| Pore type | Characteristics of dry, freshly broken surfaces at 20× magnification | Permeability | ||
|---|---|---|---|---|
| Visible | Pinpoint | Consolidation | ||
| I | Abundant to common; interconnection visible on many pores | Very abundant to common | Needle probe easily dislodges many grains from rock surface | Type I Subclasses IA:>100md IB: 10–100 md IC: 1–10 md ID: ±0.5–1 md |
| II | Scattered | Abundant to common | Needle probe can only occasionally dislodge a grain from rock surface | ± 0.5–1.0 md (depending on particle size, sorting, and clay mineral content) |
| III | None to very isolated | None to a few pores | Usually very well consolidated and/or pores filled with clays or other pore-filling material | Too tight to produce gas at commercial rates even when fractured or interbedded with type I rocks |
Examples of pore type I

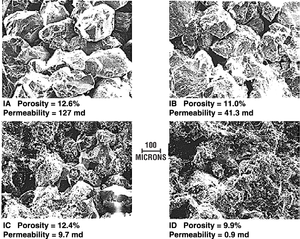
The SEM microphotographs in Figure 1 are examples of rocks with types IA, IB, IC, and ID.
Note the amount and connectivity of pore space of each subclass.
Pore types II and III

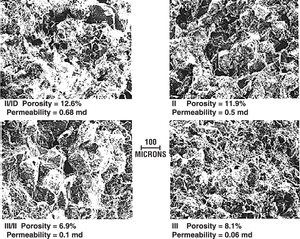
The SEM microphotographs in Figure 2 are examples of rocks with types II and III. Note the amount and connectivity of pore space of each subclass.
Procedure: predicting sandstone permeability
The procedure below is for predicting the permeability of sandstones from cuttings using 20× magnification[1].
- Estimate grain size and sorting using standard size-sorting comparators, thin section and SEM photomicrographs, and rock photographs.
- Estimate volume percentages using Terry-Chillingar charts made for volume estimates.
- Estimate consolidation using the scheme described in the preceding table.
- Describe the visible and pinpoint porosity and interconnectedness.
- Estimate permeability from rocks on comparators and/or using rock characteristics described in the preceding table. (Comparators can be made or purchased.)
- Predict permeability for the formation in prospective areas where petrophysical characteristics are believed to be similar
See also
- Sandstone porosity and permeability prediction
- Sandstone diagenetic processes
- Effect of composition and texture on sandstone diagenesis
- Hydrology and sandstone diagenesis
- Influence of depositional environment on sandstone diagenesis
- Predicting sandstone reservoir porosity
- Predicting sandstone permeability from texture