Well log sequence analysis
After seismic sections have been analyzed for sequences, well logs are analyzed for sequences and systems tracts. This involves interpreting depositional lithofacies on logs using cuttings and cores and then identifying sequences and systems tracts from the interpreted logs. Stacking patterns displayed in cross sections and individual logs show accommodation space changes which help us identify sequence and systems tracts.
Procedure[edit]
The list below, modified from Vail[1] outlines a suggested procedure for well log sequence analysis.
- Interpret depositional lithofacies on logs using cores and cuttings to calibrate the log.
- Estimate sequences and systems tracts from the interpreted lithofacies using regional cross sections with well and outcrop data.
- Determine accommodation space changes from parasequence stacking patterns seen in well log cross sections (see below).
- Check estimates of sequences and systems tracts:
- Correlate between wells that have biostratigraphic-time correlations, well log marker-bed correlations, and the global sea cycle chart.
- Correlate with seismic profiles.
Parasequence stacking patterns[edit]
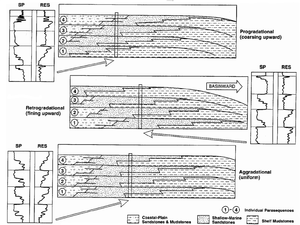
Parasequences stack into three basic patterns as a result of the interaction of accommodation and rate of sediment supply:
- Progradational
- Retrogradational
- Aggradational
Figure 1 shows these three stacking patterns.
Stacking patterns for systems tracts[edit]
Systems tracts often have characteristic parasequence stacking patterns. Stacking patterns of the basin-floor fan and slope fan, contained within the lowstand systems tract, are difficult to identify. The table below summarizes typical stacking patterns for the three systems tracts.
| Systems tract | Stacking pattern |
|---|---|
Lowstand
|
Difficult to recognize |
| Transgressive | Retrogradational |
Highstand
|
Aggradational |
Log patterns for systems tracts[edit]

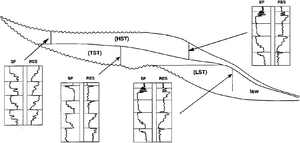
Figure 2 shows the characteristic parasequence stacking patterns for the high-stand (HST), transgressive (TST), and lowstand (LST) systems tracts of a passive margin basin third-order depositional sequence.
LST example[edit]

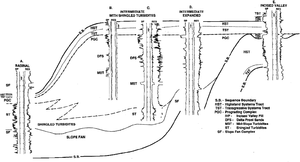
The cross section in Figure 3 is from the Late Cenozoic of the Gulf of Mexico. It shows the well log responses of a lowstand systems tract (labeled as PGC, or prograding complex, on the cross section). Log A is completely basinal with a slope fan overlain by shingled turbidites. Logs B and C have deltaic and delta front sands, and midslope turbidite sands. Log D has a “classic” coarsening-upward pattern. Log E has incised valley sands.
See also[edit]
- Geometrical analysis
- Procedure for geometrical analysis
- Other correlation features
- Seismic sequence analysis
- Combining well log with seismic sequence analysis
- Regional maps and cross sections
- Cross section
References[edit]
- ↑ Vail, P., R., 1987, Seismic stratigraphy interpretation procedure, in Bally, A., W., ed., Atlas of Seismic Stratigraphy: AAPG Studies in Geology No. 27, p. 2.
- ↑ 2.0 2.1 Hyne, N. J., 1995, Sequence stratigraphy: a new look at old rocks, in N. J. Hyne, ed., Sequence Stratigraphy of the Mid Continent: Tulsa Geological Society Special Publication 4, p. 5–20.
- ↑ Van Wagoner, J. C., R. M. Mitchum, K. M. Campion, and V. D. Rahmanian, 1990, Siliciclastic Sequence Stratigraphy in Well Logs, Cores and Outcrops: Concepts for High-Resolution Correlation of Time and Facies: AAPG Methods in Exploration Series No. 7, 55 p.
- ↑ Mitchum, R. M., P. R. Vail, and J. B. Sangree, 1977, Seismic stratigraphy and global changes in sea level, part 6: stratigraphic interpretations of seismic reflection patterns in depositional sequences, in C. E. Payton, ed., Seismic Stratigraphy and Applications to Hydrocarbon Exploration: AAPG Memoir 26, p. 117–133.
