Difference between revisions of "Relative permeability"
FWhitehurst (talk | contribs) |
Cwhitehurst (talk | contribs) m (added Category:Treatise Handbook 3 using HotCat) |
||
| (4 intermediate revisions by 3 users not shown) | |||
| Line 6: | Line 6: | ||
| part = Predicting the occurrence of oil and gas traps | | part = Predicting the occurrence of oil and gas traps | ||
| chapter = Predicting reservoir system quality and performance | | chapter = Predicting reservoir system quality and performance | ||
| − | | frompg = 9- | + | | frompg = 9-40 |
| − | | topg = 9- | + | | topg = 9-43 |
| author = Dan J. Hartmann, Edward A. Beaumont | | author = Dan J. Hartmann, Edward A. Beaumont | ||
| link = http://archives.datapages.com/data/specpubs/beaumont/ch09/ch09.htm | | link = http://archives.datapages.com/data/specpubs/beaumont/ch09/ch09.htm | ||
| Line 28: | Line 28: | ||
[[file:predicting-reservoir-system-quality-and-performance_fig9-27.png|300px|thumb|{{figure number|2}}Three relative permeability curves. Modified from Arps.<ref name=Arps_1964>Arps, J. J. 1964, [http://archives.datapages.com/data/bulletns/1961-64/data/pg/0048/0002/0150/0157.htm Engineering concepts useful in oil finding]: AAPG Bulletin, v. 48, no. 2, p. 943-961.</ref>]] | [[file:predicting-reservoir-system-quality-and-performance_fig9-27.png|300px|thumb|{{figure number|2}}Three relative permeability curves. Modified from Arps.<ref name=Arps_1964>Arps, J. J. 1964, [http://archives.datapages.com/data/bulletns/1961-64/data/pg/0048/0002/0150/0157.htm Engineering concepts useful in oil finding]: AAPG Bulletin, v. 48, no. 2, p. 943-961.</ref>]] | ||
| − | The diagram in [[:file:predicting-reservoir-system-quality-and-performance_fig9-27.png|Figure 2]] shows relationships between relative permeability curves (drainage and imbibition), [[capillary pressure]], and fluid distribution in a homogeneous section of a reservoir system. The reservoir system rock has a [[porosity]] of 30% and a permeability of 10 md (r<sub>35</sub> = 1.1μ). Laboratory single-phase air permeability is typically used to represent absolute permeability (K<sub>a</sub> when determining relative permeability to oil or water at a specific S<sub>w</sub>. | + | The diagram in [[:file:predicting-reservoir-system-quality-and-performance_fig9-27.png|Figure 2]] shows relationships between relative permeability curves (drainage and imbibition), [[capillary pressure]], and fluid distribution in a homogeneous section of a reservoir system. The reservoir system rock has a [[porosity]] of 30% and a permeability of 10 md ([[Characterizing_rock_quality#What_is_r35.3F|r<sub>35</sub>]] = 1.1μ). Laboratory single-phase air permeability is typically used to represent absolute permeability (K<sub>a</sub> when determining relative permeability to oil or water at a specific S<sub>w</sub>. |
[[:file:predicting-reservoir-system-quality-and-performance_fig9-27.png|Figure 2]] depicts three relative permeability curves: | [[:file:predicting-reservoir-system-quality-and-performance_fig9-27.png|Figure 2]] depicts three relative permeability curves: | ||
| Line 49: | Line 49: | ||
[[file:predicting-reservoir-system-quality-and-performance_fig9-28.png|300px|thumb|{{figure number|3}}Relative permeability relationships for rock with different pore types.]] | [[file:predicting-reservoir-system-quality-and-performance_fig9-28.png|300px|thumb|{{figure number|3}}Relative permeability relationships for rock with different pore types.]] | ||
| − | Every pore type has a unique relative permeability signature. Consider the hypothetical drainage relative permeability type curves shown in [[:file:predicting-reservoir-system-quality-and-performance_fig9-28.png|Figure 3]]. Curves A, B, and C represent the relative permeability relationships for rocks with different | + | Every pore type has a unique relative permeability signature. Consider the hypothetical drainage relative permeability type curves shown in [[:file:predicting-reservoir-system-quality-and-performance_fig9-28.png|Figure 3]]. Curves A, B, and C represent the relative permeability relationships for rocks with different pore types: macro, [[Wikipedia:Mesoporous material|meso]], and micro, respectively. Curve A represents a rock with greater performance capability than B or C. Note how critical water saturation decreases as pore throat size increases. Also note the changing position of K<sub>ro</sub>–K<sub>rw</sub> crossover with changes in pore throat size. |
==Critical water saturation== | ==Critical water saturation== | ||
| Line 97: | Line 97: | ||
[[Category:Predicting the occurrence of oil and gas traps]] | [[Category:Predicting the occurrence of oil and gas traps]] | ||
[[Category:Predicting reservoir system quality and performance]] | [[Category:Predicting reservoir system quality and performance]] | ||
| + | [[Category:Treatise Handbook 3]] | ||
Latest revision as of 13:31, 5 April 2022
| Exploring for Oil and Gas Traps | |

| |
| Series | Treatise in Petroleum Geology |
|---|---|
| Part | Predicting the occurrence of oil and gas traps |
| Chapter | Predicting reservoir system quality and performance |
| Author | Dan J. Hartmann, Edward A. Beaumont |
| Link | Web page |
| Store | AAPG Store |
Absolute, effective, and relative permeability
Reservoirs contain water and oil or gas in varying amounts. Each interferes with and impedes the flow of the others. The aquifer portion of a reservoir system by definition contains water as a single phase (100% Sw). The permeability of that rock to water is absolute permeability (Kab). The permeability of a reservoir rock to any one fluid in the presence of others is its effective permeability to that fluid. It depends on the values of fluid saturations. Relative permeability to oil (Kro), gas (Krg), or water (Krw) is the ratio of effective permeability of oil, gas, or water to absolute permeability. Relative permeability can be expressed as a number between 0 and 1.0 or as a percent. Pore type and formation wettability affect relative permeability.
Why kro or krg is less than kab

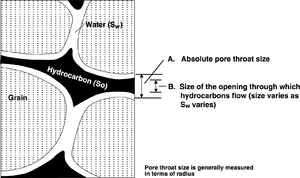
A pore system saturated 100% with any fluid transmits that fluid at a rate relative to the pore throat size and the pressure differential. In the drawing in Figure 1, the absolute pore throat size (A) is noted as the distance between grain surfaces. When a sample contains oil or gas and water (where water wets the grain surface), the pore throat size (B) for oil or gas flow is less than the absolute pore throat size (A). The thickness of the water layer coating the grains is proportional to the Sw of the rock. In other words, as buoyancy pressure increases, Sw decreases and the effective size of the pore throat for oil or gas flow (B) increases.
Interpreting a relative permeability curve

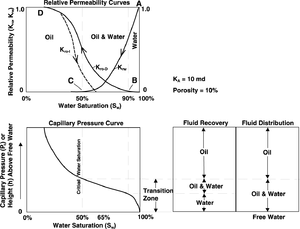
The diagram in Figure 2 shows relationships between relative permeability curves (drainage and imbibition), capillary pressure, and fluid distribution in a homogeneous section of a reservoir system. The reservoir system rock has a porosity of 30% and a permeability of 10 md (r35 = 1.1μ). Laboratory single-phase air permeability is typically used to represent absolute permeability (Ka when determining relative permeability to oil or water at a specific Sw.
Figure 2 depicts three relative permeability curves:
- Water (Krw)—similar for both drainage and imbibition tests
- Oil drainage (Kro-D)—reflects migrating oil displacing water (decreasing Sw) with increasing buoyancy pressure (Pb)
- Oil imbibition (Kro-I)—reflects reduction in oil saturation (S0) as a water front moves through a rock sample, resaturating it with water (Sxo)
The curve labeled Kro represents the relative permeability of a formation to oil in the presence of varying water saturation (Sw). The curve labeled Krw represents the relative permeability of the formation to water.
Consider points A–D below. Point A, at Sw = 100%, is the original condition of the sample. Here Krw ≈ Ka (10 md). At point B (Sw ≈ 90%, S0 = 10%), oil breaks through the sample, representing the migration saturation of the sample; Kro = 1.0. At point C (Sw ≈ 50%, So ≈ 10%), Krw is less than 1% of Ka and water, now confined to only the smallest ports, ceases to flow while oil flow approaches its maximum. At point D on the Kro-D curve (Sw ≈ 20%, So ≈ 80%), relative permeability is approaching 1.0 (~ 10 md).
Figure 2 is an example of “drainage” relative permeability of a water-wet reservoir. It shows changes in Kro and Krw as Sw decreases, as in a water-drive reservoir during hydrocarbon fill-up. “Imbibition” Kro and Krw have a different aspect, being measured while Sw increases, as it does during production in a reservoir with a water drive.
Drainage vs. imbibition curves
The drainage curve determines from computed Sw whether a zone is representative of lower transitional (Krw> Kro - D), upper transitional (Krwro - D), or free oil (Krw ≈ 0). The imbibition curve relates to performance due to filtrate invasion from water injection or flushing from natural water drive.
Pore throat size and kr
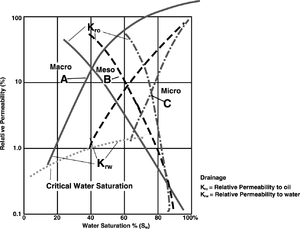
Every pore type has a unique relative permeability signature. Consider the hypothetical drainage relative permeability type curves shown in Figure 3. Curves A, B, and C represent the relative permeability relationships for rocks with different pore types: macro, meso, and micro, respectively. Curve A represents a rock with greater performance capability than B or C. Note how critical water saturation decreases as pore throat size increases. Also note the changing position of Kro–Krw crossover with changes in pore throat size.
Critical water saturation
Critical Sw is the point where water saturation is so low that no significant water cut can be measured; only hydrocarbon flows from the reservoir. At Sw higher than critical Sw, water flows with hydrocarbon. Where Sw becomes great enough, only water flows.
Critical water saturation
The critical Sw value is different for each port type. Curve A in Figure 9-28 represents rocks with macroporosity. It has a critical Sw less than 20%. Curve B represents a rock (continued) with mesoporosity. Mesoporous rocks have a critical Sw of 20–60%. Curve C represents rocks with microporosity. They have a critical Sw of 60–80%.
The table below summarizes representative critical Sw values for macro-, meso-, and micropore types that correspond to A, B, and C, respectively, in Figure 3.
| Pore type | Micro | Meso | Macro |
|---|---|---|---|
| Critical Sw | 60–80% | 20–60% | |
| Length of transition zone | >30 m | 2–30 m | 0–2 m |
See also
- Pore-fluid interaction
- Hydrocarbon expulsion, migration, and accumulation
- Characterizing rock quality
- Pc curves and saturation profiles
- Converting Pc curves to buoyancy, height, and pore throat radius
- What is permeability?
References
- ↑ Arps, J. J. 1964, Engineering concepts useful in oil finding: AAPG Bulletin, v. 48, no. 2, p. 943-961.
