Difference between revisions of "Geological heterogeneities"
Cwhitehurst (talk | contribs) |
Cwhitehurst (talk | contribs) |
||
| Line 39: | Line 39: | ||
[[file:geological-heterogeneities_fig4.png|thumb|{{figure number|4}}Synthetic reservoir cross section showing the vertical and lateral distribution of shales (black) within a sandstone (white) sequence. (Modified from <ref name=pt06r44 />.)]] | [[file:geological-heterogeneities_fig4.png|thumb|{{figure number|4}}Synthetic reservoir cross section showing the vertical and lateral distribution of shales (black) within a sandstone (white) sequence. (Modified from <ref name=pt06r44 />.)]] | ||
| − | In the absence of sufficient quantitative information on different depositional systems, statistical methods of predicting interwell variability have proven useful (see [[ | + | In the absence of sufficient quantitative information on different depositional systems, statistical methods of predicting interwell variability have proven useful (see [[Intro to geological methods]]). For example, the literature contains many examples of statistics applied to analysis of the lateral continuity and spatial distribution of shales, since fluid flow in a reservoir is particularly sensitive to shale distribution. One commonly cited example<ref name=pt06r152>Weber, K. J., 1982, Influence of common sedimentary structures on fluid flow in reservoir models: Journal of Petroleum Technology, March, p. 665–772.</ref> predicts the anticipated lengths of shales as a function of depositional environments, so that if the depositional environment of a reservoir sequence is known, measurements of shale thicknesses in wells can be used to generate (using a random number generator) a synthetic reservoir cross section ([[:file:geological-heterogeneities_fig4.png|Figure 4]]). This approach is particularly fruitful when the lateral dimensions of the shale are thought to be less than well spacings (uncorrelatable or ''stochastic'' shales, as opposed to correctable or ''deterministic'' shales whose lateral dimensions are greater than well spacings.<ref name=pt06r44>Haldorsen, H. H., Lake, L. W., 1984, A new approach to shale management in field-scale models: Society of Petroleum Engineers Journal, Aug., p. 447–452.</ref> Statistical methods have also been used to evaluate lateral variations in reservoir properties of sandstones. For example, Stalkup<ref name=pt06r134>Stalkup, F. I., 1986, [[Permeability]] variations observed at the faces of crossbedded sandstone outcrops, in Lake, L. W., Carroll, H. B., Jr., eds., Reservoir Characterization: Orlando, FL, Academy Press, p. 141–180.</ref> found considerable lateral variability in outcrop measurements of permeability of shallow marine and fluvial sandstones and suggested that permeability distribution should also be described stochastically rather than deterministically. |
Standard seismic reflection methods generally cannot resolve reservoir heterogeneities at the interwell scale. Crosshole seismic tomography<ref name=pt06r136>Stewart, R. R., 1987, Seismic tomography: SEG Continuing Education Program Notes, GENIX Tech. Ltd.</ref> offers promise for high resolution reservoir description at the interwell and fieldwide scales, as well as for monitoring [[enhanced oil recovery]] projects. | Standard seismic reflection methods generally cannot resolve reservoir heterogeneities at the interwell scale. Crosshole seismic tomography<ref name=pt06r136>Stewart, R. R., 1987, Seismic tomography: SEG Continuing Education Program Notes, GENIX Tech. Ltd.</ref> offers promise for high resolution reservoir description at the interwell and fieldwide scales, as well as for monitoring [[enhanced oil recovery]] projects. | ||
Revision as of 19:39, 14 February 2014
| Development Geology Reference Manual | |

| |
| Series | Methods in Exploration |
|---|---|
| Part | Geological methods |
| Chapter | Geological heterogeneities |
| Author | Roger M. Slatt, William E. Galloway |
| Link | Web page |
| Store | AAPG Store |
The term reservoir heterogeneity is used here to describe the geological complexity of a reservoir and the relationship of that complexity to the flow of fluids through it.[1]
Reservoirs are inherently heterogeneous assemblages of depositional facies and subfacies (for more information, see Clastic lithofacies and Carbonate lithofacies), each with characteristic and commonly differing sediment textures, stratification types, and bedding architectures. Variability is compounded by postdepositional alterations of the strata, such as through compaction, cementation, and tectonic deformation. Geological heterogeneities have been classified in a variety of ways according to their size or scale; the common categories, used here, are wellbore, interwell, and fieldwide scales of heterogeneity (Figure 1).
Heterogeneities at the wellbore scale affect matrix permeability, distribution of residual oil, directional flow of fluids, potential fluid-rock interactions, and formation damage. Heterogeneities at the interwell scale affect fluid flow patterns, drainage efficiency of the reservoir, and vertical and lateral sweep efficiency of secondary and tertiary recovery projects. Heterogeneities at the fieldwide scale determine the in-place hydrocarbon volume, areal distribution, and trend of hydrocarbon production.
Wellbore scale heterogeneities[edit]
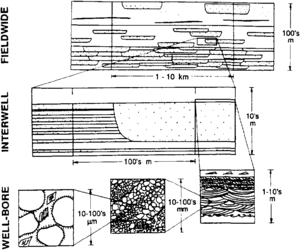
Elements of wellbore heterogeneities include the pore network (pores and pore throats), grain size and composition, grain packing, lamination and bedding styles, sedimentary structures, lithofacies, and vertical stratification sequences. These properties can be readily described in a numerical or quantitative fashion because of the usual availability of rock samples and well logs. Rock cores provide the best information on lithofacies and stratification sequences, plug or whole core porosity, permeability, and fluid saturation (if oil-based drilling mud was used during coring). The use of log shapes for facies recognition, as well as sidewall samples, micrologs, and dipmeter tools can also provide indirect information on Uthofacies and stratification types. (For more on lithofacies, see Clastic lithofacies and Carbonate lithofacies). Pore networks, grain size characteristics, and mineralogy can be analyzed by routine thin section petrography as well as by X-ray diffraction, scanning electron microscopy, capillary pressure measurements, and petrographic image analysis (see Reservoir quality). Analysis of all or most of these properties is essential for adequate reservoir description because these properties provide the database and thus the foundation for reservoir description at larger scales. (For information on these types of analyses, see Wireline methods and Laboratory methods.)
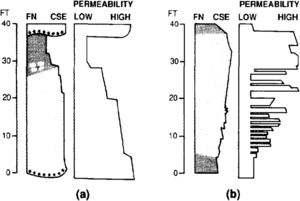
In clastic rocks, there is usually a direct relationship between primary depositional lithofacies and reservoir properties and performance. For example, sandstones that become progressively thinner bedded and finer grained stratigraphically upward also become progressively less permeable upward (Figure 2) so that during waterflood, both gravity and higher permeability toward the bottom will pull water down. In contrast, sandstones that become progressively thicker bedded and coarser grained upward also become more permeable upward (Figure 2) so that during waterflood, gravity still pulls the water down, but permeability pulls the water up, resulting in better vertical sweep.[3][4]
Interwell scale heterogeneities[edit]
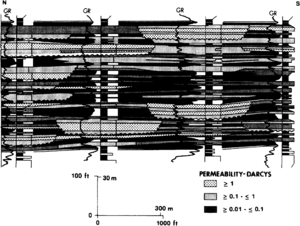
Elements of interwell scale heterogeneity include lateral bedding geometries, styles, and continuity; systematic lateral and vertical textural patterns; and resultant variations in reservoir quality. This scale of heterogeneity is probably the most difficult to quantify because wellbore data of the type previously described must be extrapolated to the interwell region. In many instances, between well correlations are difficult because lithofacies may not be continuous at interwell spacings. Thus, interpretation must be guided by an understanding of depositional environments and facies, interpreted from core analysis and compared with modern environments or outcrop analogs where actual observations and measurements have been made.
Relatively few reliable quantitative studies of depositional environments and facies have been published, and those that have suggest considerable variability in interwell scale heterogeneities among different depositional systems, as well as within any one system. Excellent examples include Scheihing and Gaynor[5] and Krause et al.[6] for shelf sandstones; van de Graaff and Ealey[4] for fluviodeltaic sequences (Figure 3); and Jordan and Pryor[7] for fluvial sands.
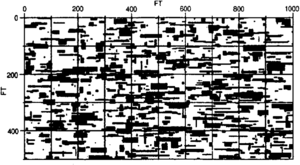
In the absence of sufficient quantitative information on different depositional systems, statistical methods of predicting interwell variability have proven useful (see Intro to geological methods). For example, the literature contains many examples of statistics applied to analysis of the lateral continuity and spatial distribution of shales, since fluid flow in a reservoir is particularly sensitive to shale distribution. One commonly cited example[9] predicts the anticipated lengths of shales as a function of depositional environments, so that if the depositional environment of a reservoir sequence is known, measurements of shale thicknesses in wells can be used to generate (using a random number generator) a synthetic reservoir cross section (Figure 4). This approach is particularly fruitful when the lateral dimensions of the shale are thought to be less than well spacings (uncorrelatable or stochastic shales, as opposed to correctable or deterministic shales whose lateral dimensions are greater than well spacings.[8] Statistical methods have also been used to evaluate lateral variations in reservoir properties of sandstones. For example, Stalkup[10] found considerable lateral variability in outcrop measurements of permeability of shallow marine and fluvial sandstones and suggested that permeability distribution should also be described stochastically rather than deterministically.
Standard seismic reflection methods generally cannot resolve reservoir heterogeneities at the interwell scale. Crosshole seismic tomography[11] offers promise for high resolution reservoir description at the interwell and fieldwide scales, as well as for monitoring enhanced oil recovery projects.
Fieldwide scale heterogeneities[edit]
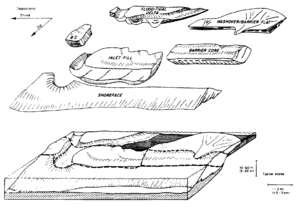
Elements of fieldwide variability include reservoir thickness, facies geometries and continuity, and bulk reservoir properties. Like interwell heterogeneity, heterogeneities at this scale are difficult to assess because information derived at smaller scales must be scaled up and generalized. Depositional models, determined by geological description at the smaller scales, provide the main basis for interpreting fieldwide reservoir architecture. (For more on depositional models, see Lithofacies and environmental analysis of clastic depositional systems and Carbonate reservoir models: facies, diagenesis, and flow characterization.) It is very important to describe the reservoir at this scale adequately because reservoirs, being complex depositional systems, are often compartmentalized (Figure 5), and separate compartments may not be in communication (see Evaluating stratigraphically complex fields).
Compartmentalization gives rise to regional patterns of variability in reservoir characteristics and production performance that directly reflect variability in facies distributions or, more precisely, geological flow units. Unfortunately, it is not always possible to uniquely define the depositional environment and facies distribution because the reservoir, and the geographic distribution of the database from which to formulate an interpretation, may be smaller than the entire depositional system from which the reservoir originates (see Tillman & Jordan[13] and Slatt et al.[14] for examples).
At this scale, analysis of conventional two-dimensional seismic data, inverted two-dimensional seismic (Seislog), and vertical seismic profiling may be useful in delineating gross architectural elements. With recent improvements in acquisition, processing, and interpretation procedures, three-dimensional seismic is more widely used for reservoir delineation. Brown[15] provides several examples of the determination and mapping of structure, fluid contacts, porosity, bed thickness, lateral bed continuity, and various other attributes of reservoirs using three-dimensional seismic methods. (For more on using seismic data to help delineate reservoir heterogeneity, see Introduction to geological methods.)
See also[edit]
- Introduction to geological methods
- Lithofacies and environmental analysis of clastic depositional systems
- Flow units for reservoir characterization
- Effective pay determination
- Reservoir quality
- Evaluating stratigraphically complex fields
- Evaluating diagenetically complex reservoirs
References[edit]
- ↑ Alpay, O. A., 1972, A practical approach to defining reservoir heterogeneity: Journal of Petroleum Technology, 24, p. 841–848., 10., 2118/3608-PA
- ↑ Weber, K. J., 1986, How heterogeneity affects oil recovery, in Lake, L. W., Carroll, H. B. J., eds., Reservoir Characterization: Orlando, FL, Academy Press, p. 487–544.
- ↑ Lassiter, T. K., Waggoner, J. R., Lake, L. W., 1986, Reservoir heterogeneities and their influence on ultimate recovery, in Lake, L. W., Carroll, N. B., Jr., eds., Reservoir Characterization: Orlando, FL, Academy Press, p. 545–560.
- ↑ 4.0 4.1 4.2 van de Graaff, W. J. E., Ealey, P. S. 1989, Geological modeling for simulation studies: AAPG Bulletin, v. 73, p. 1436–1444.
- ↑ Gaynor, G. C., Scheihing, M. H., 1988, Shelf depositional environments and reservoir characteristics of the Kuparuk River Formation (Lower Cretaceous), Kuparuk field, North Slope, Alaska, in Lomando, A. J., Harris, P. M., eds., Giant oil and gas fields—A core workshop: Society of Economic Paleontologists and Mineralogists Core Workshop 12, p. 333–389.
- ↑ Krause, F. F., Collins, H. N., Nelson, D. A., Mochemer, S. D., French, P. R., 1987, Multiscale anatomy of a reservoir— geological characterization of Pembina-Cardium pool, west-central Alberta, Canada: AAPG Bulletin, v. 71, p. 1233–2260.
- ↑ Jordan, D. W., Pryor, W. A., 1992, Hierarchical levels of heterogeneity in a Mississippi River meander belt and application to reservoir systems: AAPG Bulletin, v. 76, p. 1601–1624.
- ↑ 8.0 8.1 Haldorsen, H. H., Lake, L. W., 1984, A new approach to shale management in field-scale models: Society of Petroleum Engineers Journal, Aug., p. 447–452.
- ↑ Weber, K. J., 1982, Influence of common sedimentary structures on fluid flow in reservoir models: Journal of Petroleum Technology, March, p. 665–772.
- ↑ Stalkup, F. I., 1986, Permeability variations observed at the faces of crossbedded sandstone outcrops, in Lake, L. W., Carroll, H. B., Jr., eds., Reservoir Characterization: Orlando, FL, Academy Press, p. 141–180.
- ↑ Stewart, R. R., 1987, Seismic tomography: SEG Continuing Education Program Notes, GENIX Tech. Ltd.
- ↑ Galloway, W. E., Cheng, E. S. S., 1985, Reservoir facies architecture in a microtidal barrier system—Frio Formation, Texas Gulf Coast: The University of Texas Bureau of Economic Geology, Report of Investigations, v. 144, 36 p.
- ↑ Tillman, R. W., Jordan, D. W., 1987, Sedimentology and subsurface geology of deltaic forces, Admire GSO Sandstone, El Dorado field, Kansas, in Tillman, R. W., Weber, K. J., eds., Reservoir Sedimentology: SEPM Special Publication 40, p. 221–292.
- ↑ Slatt, R. M., Phillips, S., Boak, J. M., Lagoe, M. B., 1993, Scales of geological heterogeneity of a deep-water sand giant oil field, Long Beach unit, Wilmington field, California, in Rhodes, E. G., Moslow, T. F., eds., Marine Clastic Reservoirs—Examples and Analogs: New York, Springer-Verlag.
- ↑ Brown, A. R., 1986 Interpretation of three-dimensional seismic data: AAPG Memoir 42, 194 p.