Difference between revisions of "Capillary pressure"
FWhitehurst (talk | contribs) |
Cwhitehurst (talk | contribs) m (added Category:Methods in Exploration 10 using HotCat) |
||
| (10 intermediate revisions by 2 users not shown) | |||
| Line 12: | Line 12: | ||
| pdf = http://archives.datapages.com/data/specpubs/methodo1/images/a095/a0950001/0200/02210.pdf | | pdf = http://archives.datapages.com/data/specpubs/methodo1/images/a095/a0950001/0200/02210.pdf | ||
}} | }} | ||
| − | Capillary pressure concepts can be used by geologists, petrophysicists, and petroleum engineers to evaluate the following: | + | Capillary pressure concepts can be used by geologists, petrophysicists, and [[petroleum]] engineers to evaluate the following: |
* Reservoir rock quality | * Reservoir rock quality | ||
* Pay versus nonpay | * Pay versus nonpay | ||
* Expected fluid saturations | * Expected fluid saturations | ||
| − | * Seal capacity (thickness of hydrocarbon column a seal can hold before it leaks) | + | * Seal capacity (thickness of [[hydrocarbon column]] a seal can hold before it leaks) |
* Depth of the reservoir [[fluid contacts]] | * Depth of the reservoir [[fluid contacts]] | ||
* Thickness of the transition zone | * Thickness of the transition zone | ||
| Line 30: | Line 30: | ||
[[File:charles-l-vavra-john-g-kaldi-robert-m-sneider_capillary-pressure_2.jpg|300px|thumb|{{figure_number|2}}The wetting phase rises above the original or free surface in the capillary tube experiment until adhesive and gravitational forces balance. Capillary pressure (P<sub>c</sub>) is the difference in pressure measured across the interface in the capillary (''P''<sub>c</sub> = ''P''<sub>nw</sub> - ''P''<sub>w</sub>). This pressure results from the contrast in pressure gradients caused by the different densities of the nonwetting (''ρ''<sub>nw</sub>) and wetting (''ρ''<sub>w</sub>) phases (right).]] | [[File:charles-l-vavra-john-g-kaldi-robert-m-sneider_capillary-pressure_2.jpg|300px|thumb|{{figure_number|2}}The wetting phase rises above the original or free surface in the capillary tube experiment until adhesive and gravitational forces balance. Capillary pressure (P<sub>c</sub>) is the difference in pressure measured across the interface in the capillary (''P''<sub>c</sub> = ''P''<sub>nw</sub> - ''P''<sub>w</sub>). This pressure results from the contrast in pressure gradients caused by the different densities of the nonwetting (''ρ''<sub>nw</sub>) and wetting (''ρ''<sub>w</sub>) phases (right).]] | ||
| − | If the end of a narrow capillary tube is placed in a wetting fluid, net adhesive forces draw the fluid into the tube ([[:File:charles-l-vavra-john-g-kaldi-robert-m-sneider_capillary-pressure_2.jpg | + | If the end of a narrow capillary tube is placed in a wetting fluid, net adhesive forces draw the fluid into the tube ([[:File:charles-l-vavra-john-g-kaldi-robert-m-sneider_capillary-pressure_2.jpg|Figure 2]]). The wetting phase rises in the capillary above the original interface or ''free surface'' until adhesive and gravitational forces are balanced. Because the wetting and nonwetting fluids have different densities, they also have different pressure gradients ([[:File:charles-l-vavra-john-g-kaldi-robert-m-sneider_capillary-pressure_2.jpg|Figure 2]]). ''Capillary pressure'' (''P''<sub>c</sub>) is defined as the difference in pressure across the meniscus in the capillary tube. Put another way, capillary pressure is the amount of extra pressure required to force the nonwetting phase to displace the wetting phase in the capillary. Capillary pressure can be calculated as follows: |
:<math>P_\mathrm{c} = (\rho_\mathrm{w} - \rho_\mathrm{nw}) g h</math>, or | :<math>P_\mathrm{c} = (\rho_\mathrm{w} - \rho_\mathrm{nw}) g h</math>, or | ||
| Line 47: | Line 47: | ||
These equations show that capillary pressure increases with greater height above the free surface and with smaller capillary size. | These equations show that capillary pressure increases with greater height above the free surface and with smaller capillary size. | ||
| − | The importance of capillary pressure in reservoir studies is that many reservoir rocks can be approximated by a bundle of capillaries, with formation water being the wetting phase and hydrocarbons the nonwetting phase. As hydrocarbons begin to migrate into a rock, displacing the pore water, the hydrocarbons first enter the pores with the largest pore throats (capillaries), leaving the wetting phase (water) in the pores with smaller throats or in small nooks and crannies (surface roughness). As the hydrocarbon column increases, the height above the surface where ''P''<sub>c</sub> = 0, called the free surface or ''free water level'' (FWL), becomes greater and the capillary pressure increases, allowing hydrocarbons to enter pores with smaller and smaller throats. This process continues until one of several things occurs: | + | The importance of capillary pressure in reservoir studies is that many reservoir rocks can be approximated by a bundle of capillaries, with formation water being the wetting phase and hydrocarbons the nonwetting phase. As hydrocarbons begin to migrate into a rock, displacing the pore water, the hydrocarbons first enter the pores with the largest pore throats (capillaries), leaving the wetting phase (water) in the pores with smaller throats or in small nooks and crannies (surface roughness). As the hydrocarbon column increases, the height above the surface where ''P''<sub>c</sub> = 0, called the free surface or ''[[free water level]]'' (FWL), becomes greater and the capillary pressure increases, allowing hydrocarbons to enter pores with smaller and smaller throats. This process continues until one of several things occurs: |
# [[Petroleum generation|generation]] or migration ends, | # [[Petroleum generation|generation]] or migration ends, | ||
# the trap reaches its spill point, or | # the trap reaches its spill point, or | ||
| − | # capillary pressure is sufficient to force hydrocarbons into the seal (displacement pressure is exceeded), allowing the seal to leak. | + | # capillary pressure is sufficient to force hydrocarbons into the seal ([[top seal displacement pressure|displacement pressure]] is exceeded), allowing the seal to leak. |
==Measuring capillary pressure== | ==Measuring capillary pressure== | ||
| Line 65: | Line 65: | ||
Mercury injection capillary pressure data are acquired by injecting mercury into an evacuated, cleaned, and extracted core plug. Mercury injection pressure is increased in a stepwise manner, and the percentage of rock pore volume saturated by mercury at each step is recorded after allowing sufficient time for equilibrium to be reached. The pressure is then plotted against the mercury saturation ([[:File:charles-l-vavra-john-g-kaldi-robert-m-sneider_capillary-pressure_3.jpg|Figure 3]]), resulting in the injection curve (which is also called the drainage curve because the wetting phase is being drained from the sample). | Mercury injection capillary pressure data are acquired by injecting mercury into an evacuated, cleaned, and extracted core plug. Mercury injection pressure is increased in a stepwise manner, and the percentage of rock pore volume saturated by mercury at each step is recorded after allowing sufficient time for equilibrium to be reached. The pressure is then plotted against the mercury saturation ([[:File:charles-l-vavra-john-g-kaldi-robert-m-sneider_capillary-pressure_3.jpg|Figure 3]]), resulting in the injection curve (which is also called the drainage curve because the wetting phase is being drained from the sample). | ||
| − | The pressure at which mercury first enters the sample (after the mercury has filled any surface irregularities on the sample) is termed the ''displacement pressure'' (''P''<sub>d</sub>). The percentage of pore volume saturated by mercury at the maximum pressure is the ''maximum saturation'' (''S''<sub>max</sub>). The unsaturated pore volume at that pressure is the ''minimum unsaturated pore volume'' (''u''<sub>min</sub>) ([[:File:charles-l-vavra-john-g-kaldi-robert-m-sneider_capillary-pressure_3.jpg|Figure 3]]). This is sometimes incorrectly referred to as [http://petrowiki.org/Glossary%3AIrreducible_water_saturation irreducible saturation]. This term is inappropriate for the air-mercury system because saturation depends on applied pressure and on the duration of the experiment.<ref name=Wardlaw_etal_1976 /> | + | The pressure at which mercury first enters the sample (after the mercury has filled any surface irregularities on the sample) is termed the ''[[displacement pressure]]'' (''P''<sub>d</sub>). The percentage of pore volume saturated by mercury at the maximum pressure is the ''maximum saturation'' (''S''<sub>max</sub>). The unsaturated pore volume at that pressure is the ''minimum unsaturated pore volume'' (''u''<sub>min</sub>) ([[:File:charles-l-vavra-john-g-kaldi-robert-m-sneider_capillary-pressure_3.jpg|Figure 3]]). This is sometimes incorrectly referred to as [http://petrowiki.org/Glossary%3AIrreducible_water_saturation irreducible saturation]. This term is inappropriate for the air-mercury system because saturation depends on applied pressure and on the duration of the experiment.<ref name=Wardlaw_etal_1976 /> |
After the maximum pressure is reached, the pressure is reduced in steps and air (the wetting phase) is allowed to imbibe into the sample. The amount of mercury expelled from the sample at each pressure is expressed as a percentage of total pore volume or bulk volume. Again, pressure is plotted against mercury saturation in the withdrawal curve ([[:File:charles-l-vavra-john-g-kaldi-robert-m-sneider_capillary-pressure_3.jpg|Figure 3]]). The volume of pore space still saturated with mercury after pressure is reduced to the minimum is called ''the residual mercury saturation'' (S<sub>R</sub>). | After the maximum pressure is reached, the pressure is reduced in steps and air (the wetting phase) is allowed to imbibe into the sample. The amount of mercury expelled from the sample at each pressure is expressed as a percentage of total pore volume or bulk volume. Again, pressure is plotted against mercury saturation in the withdrawal curve ([[:File:charles-l-vavra-john-g-kaldi-robert-m-sneider_capillary-pressure_3.jpg|Figure 3]]). The volume of pore space still saturated with mercury after pressure is reduced to the minimum is called ''the residual mercury saturation'' (S<sub>R</sub>). | ||
| Line 100: | Line 100: | ||
|} | |} | ||
| − | Relating withdrawal efficiency in the air-mercury system to recovery efficiency in the hydrocarbon-water system is dependent on properties of the fluids as well as properties of the pore system. Fluid properties that affect recovery include viscosity, density, interfacial tension, [[wettability]], contact angle hysteresis, and rate of displacement.<ref name=Wardlaw_etal_1978 /> Nevertheless, for a given range of fluid properties in a water wet reservoir, the same pore geometry factors that contribute to increased mercury withdrawal efficiency also increase hydrocarbon recovery efficiency. | + | Relating withdrawal efficiency in the air-mercury system to recovery efficiency in the hydrocarbon-water system is dependent on properties of the fluids as well as properties of the pore system. Fluid properties that affect recovery include [[viscosity]], density, interfacial tension, [[wettability]], contact angle hysteresis, and rate of displacement.<ref name=Wardlaw_etal_1978 /> Nevertheless, for a given range of fluid properties in a water wet reservoir, the same pore geometry factors that contribute to increased mercury withdrawal efficiency also increase hydrocarbon recovery efficiency. |
==Reservoir applications== | ==Reservoir applications== | ||
| Line 127: | Line 127: | ||
| Air–mercury || 140° || 480 | | Air–mercury || 140° || 480 | ||
|- | |- | ||
| − | | Crude | + | | [[Crude oil]]–water || 0° || 35 |
|} | |} | ||
| − | ''<small>* Contact angle is measured on a quartz plane during drainage</small>'' | + | ''<small>* Contact angle is measured on a [[quartz]] plane during drainage</small>'' |
{| class="wikitable" | {| class="wikitable" | ||
| Line 169: | Line 169: | ||
* ''P<sub>dS</sub>'' = brine-hydrocarbon displacement pressure of the seal (in psi) | * ''P<sub>dS</sub>'' = brine-hydrocarbon displacement pressure of the seal (in psi) | ||
* ''P<sub>dR</sub>'' = brine-hydrocarbon displacement pressure of the reservoir rock (in psi) | * ''P<sub>dR</sub>'' = brine-hydrocarbon displacement pressure of the reservoir rock (in psi) | ||
| + | |||
| + | It is difficult to determine the [[Top seal displacement pressure|displacement pressure (P<sub>d</sub>) of a top seal]]. | ||
| + | |||
| + | * First, [[seal capacity]] is based on the presence of a single, continuous, high-P<sub>d</sub> layer, not upon an arithmetic average of all P<sub>d</sub> values. The trapping capacity is determined by the highest displacement pressure within a seal, theoretically even if that interval is a layer only one grain thick. A 500-m-thick siltstone may appear incapable of trapping more than [[length::1 m]] of hydrocarbon. The presence of a 1-cm-thick claystone layer, however, may create a seal for thousands of meters of hydrocarbon. Predicting these local seals is difficult and adds a measure of risk to any evaluation of intact top seals using capillary theory. | ||
| + | * Second, experiments demonstrate that hydrocarbon [[migration]] through a seal does not occur along a broad, uniform front but along narrow fingers reflecting local, tortuous pathways of low displacement pressure.<ref name=ch10r17>Dembecki, H., Jr., Anderson, M., J., 1989, [http://archives.datapages.com/data/bulletns/1988-89/data/pg/0073/0008/1000/1018.htm Secondary migration of oil: experiments supporting efficient movement of separate, buoyant oil phase along limited conduits]: AAPG Bulletin, vol. 73, no. 8, p. 1018–1021.</ref><ref name=ch10r12>CatalanXiaown, L., F., Chatzis, I., Dullien, F., A., L., 1992, [http://archives.datapages.com/data/bulletns/1992-93/data/pg/0076/0005/0000/0638.htm An experimental study of secondary oil migration]: AAPG Bulletin, vol. 76, no. 5, p. 638–650.</ref> | ||
| + | |||
| + | These tortuous pathways develop even in bead packs of uniform, closely packed glass spheres. Natural seals are even more heterogeneous. | ||
| + | |||
| + | The difficulty of defining these narrow zones during sampling complicates our ability to predict the critical displacement pressure of a seal. Although 99% of the samples from a trap may indicate a top seal capable of trapping a 500-m oil column, the seal may well leak through a narrow pathway only centimeters in diameter. | ||
===Additional applications=== | ===Additional applications=== | ||
| Line 198: | Line 207: | ||
[[Category:Laboratory methods]] | [[Category:Laboratory methods]] | ||
| + | [[Category:Methods in Exploration 10]] | ||
Latest revision as of 16:59, 19 January 2022
| Development Geology Reference Manual | |

| |
| Series | Methods in Exploration |
|---|---|
| Part | Laboratory methods |
| Chapter | Capillary pressure |
| Author | Charles L. Vavra, John G. Kaldi, Robert M. Sneider |
| Link | Web page |
| PDF file (requires access) | |
Capillary pressure concepts can be used by geologists, petrophysicists, and petroleum engineers to evaluate the following:
- Reservoir rock quality
- Pay versus nonpay
- Expected fluid saturations
- Seal capacity (thickness of hydrocarbon column a seal can hold before it leaks)
- Depth of the reservoir fluid contacts
- Thickness of the transition zone
- An approximation of the recovery efficiency during primary or secondary recovery.
Evaluating capillary pressure of potential reservoir and seal rocks is important because capillarity controls the static distribution of fluids in the reservoir prior to production and remaining hydrocarbons after primary production.
Capillary pressure concepts[edit]
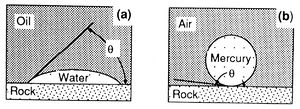
Capillary pressure results from interactions of forces acting within and between fluids and their bounding solids. These include both cohesive forces (surface and interfacial tension) and adhesive (liquid-solid) forces. When adhesive forces are greater than cohesive forces, the liquid is said to be wetting (Figure 1a). When cohesive forces exceed adhesive forces, the liquid is nonwetting (Figure 1b). The relative wettability of the fluids is described by the contact angle (θ), which is the angle between the solid and the fluid-fluid interface as measured through the denser fluid (Figure 1).
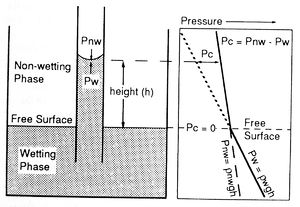
If the end of a narrow capillary tube is placed in a wetting fluid, net adhesive forces draw the fluid into the tube (Figure 2). The wetting phase rises in the capillary above the original interface or free surface until adhesive and gravitational forces are balanced. Because the wetting and nonwetting fluids have different densities, they also have different pressure gradients (Figure 2). Capillary pressure (Pc) is defined as the difference in pressure across the meniscus in the capillary tube. Put another way, capillary pressure is the amount of extra pressure required to force the nonwetting phase to displace the wetting phase in the capillary. Capillary pressure can be calculated as follows:
- , or
where
- ρw = density of the wetting nonwetting fluid
- ρnw = density of the nonwetting fluid
- g = gravitational constant
- h = height above the free surface
- σ = interfacial tension
- θ = contact angle between the fluids and the capillary tube
- rc = radius of the capillary
These equations show that capillary pressure increases with greater height above the free surface and with smaller capillary size.
The importance of capillary pressure in reservoir studies is that many reservoir rocks can be approximated by a bundle of capillaries, with formation water being the wetting phase and hydrocarbons the nonwetting phase. As hydrocarbons begin to migrate into a rock, displacing the pore water, the hydrocarbons first enter the pores with the largest pore throats (capillaries), leaving the wetting phase (water) in the pores with smaller throats or in small nooks and crannies (surface roughness). As the hydrocarbon column increases, the height above the surface where Pc = 0, called the free surface or free water level (FWL), becomes greater and the capillary pressure increases, allowing hydrocarbons to enter pores with smaller and smaller throats. This process continues until one of several things occurs:
- generation or migration ends,
- the trap reaches its spill point, or
- capillary pressure is sufficient to force hydrocarbons into the seal (displacement pressure is exceeded), allowing the seal to leak.
Measuring capillary pressure[edit]
Reservoir capillary pressure relationships can be evaluated by using either of the following:
- Porous plate or centrifuge method, which uses the actual or simulated hydrocarbon-brine system of the reservoir to approximate the wetting properties
- Mercury injection, which simulates the premigration wetting characteristics of the reservoir
The mercury injection method is recommended to evaluate the initial static distributions of reservoir fluids prior to production because these distributions are typically controlled by the premigration wetting characteristics. Mercury injection is also favored because it is simpler, cheaper, and less time consuming than porous plate or centrifuge methods. In addition, mercury injection can be conducted on cuttings or sidewall samples. Mercury injection capillary pressure data can also be converted to the reservoir fluid system. Although this involves a number of assumptions on wettability and the effects of cleaning and extracting the core are largely ignored, the cost and time benefits typically favor mercury injection.
Terminology and mercury injection systematics[edit]
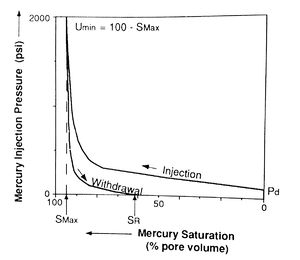
Mercury injection capillary pressure data are acquired by injecting mercury into an evacuated, cleaned, and extracted core plug. Mercury injection pressure is increased in a stepwise manner, and the percentage of rock pore volume saturated by mercury at each step is recorded after allowing sufficient time for equilibrium to be reached. The pressure is then plotted against the mercury saturation (Figure 3), resulting in the injection curve (which is also called the drainage curve because the wetting phase is being drained from the sample).
The pressure at which mercury first enters the sample (after the mercury has filled any surface irregularities on the sample) is termed the displacement pressure (Pd). The percentage of pore volume saturated by mercury at the maximum pressure is the maximum saturation (Smax). The unsaturated pore volume at that pressure is the minimum unsaturated pore volume (umin) (Figure 3). This is sometimes incorrectly referred to as irreducible saturation. This term is inappropriate for the air-mercury system because saturation depends on applied pressure and on the duration of the experiment.[1]
After the maximum pressure is reached, the pressure is reduced in steps and air (the wetting phase) is allowed to imbibe into the sample. The amount of mercury expelled from the sample at each pressure is expressed as a percentage of total pore volume or bulk volume. Again, pressure is plotted against mercury saturation in the withdrawal curve (Figure 3). The volume of pore space still saturated with mercury after pressure is reduced to the minimum is called the residual mercury saturation (SR).
Data from the mercury injection curve can be used to approximate the distribution of pore volume accessible by throats of given effective radii (in cm) using the following equation:
where
- σ = interfacial tension of the air-mercury system (480 dynes/cm)
- θ = air/mercury/solid contact angle (140°)
- Pc = capillary pressure in dynes/cm2 (1 psi = 69035 dynes/cm2)
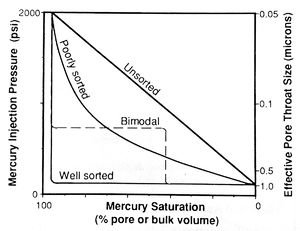
Note that this equation calculates the radius of a cylindrical capillary tube; however, real pore throats have very complex geometries. Therefore, the calculated values represent the effective radii of the pore throats, which may not equal their actual dimensions. Samples dominated by throats of similar size (well sorted) have broad, flat plateaus (Figure 4). As [[Core_description#Maturity|sorting] becomes poorer, the plateau steepens then disappears and the slope of the curve approaches 45° (unsorted).
Data from the mercury withdrawal (air imbibition) curve can provide information regarding the efficiency with which the nonwetting phase can be withdrawn from the pore system. Withdrawal efficiency (WE) is defined as the ratio of the mercury saturation in the sample at minimum pressure after pressure is reduced (SR) to the saturation at maximum pressure (Smax) (Figure 3).[1] Because few samples reach 100% mercury saturation at routinely available injection pressures, data are normalized by the following equation:
Withdrawal efficiency in the air-mercury system is controlled exclusively by pore geometry, which can be interpreted from the capillary pressure curves and by direct observation of the rock or an epoxy resin pore cast. Critical pore geometry factors affecting withdrawal efficiency include effective pore throat heterogeneity; the ratio of pore body to pore throat size (rb/rt); and the number of throats connecting each pore (coordination number). Table 1 shows the effect of these parameters on withdrawal efficiency.
| Factor | High RE | Low RE |
|---|---|---|
| Pore throat heterogeneity | Low | High |
| Pore body to pore throat size ratio | Low | High |
| Coordination number | High | Low |
Relating withdrawal efficiency in the air-mercury system to recovery efficiency in the hydrocarbon-water system is dependent on properties of the fluids as well as properties of the pore system. Fluid properties that affect recovery include viscosity, density, interfacial tension, wettability, contact angle hysteresis, and rate of displacement.[2] Nevertheless, for a given range of fluid properties in a water wet reservoir, the same pore geometry factors that contribute to increased mercury withdrawal efficiency also increase hydrocarbon recovery efficiency.
Reservoir applications[edit]
Conversion from air-mercury to brine-hydrocarbon system[edit]
Before mercury injection data can be applied to reservoirs, the data must be converted from the air-mercury system to the brine-hydrocarbon system of the reservoir using the following relationship:
where
- PCb/hc = capillary pressure in the brine-hydrocarbon system of the reservoir
- PCa/m = capillary pressure in the air-mercury system
- σb/hc = interfacial tension of the brine-hydrocarbon system
- σa/m = interfacial tension of air-mercury system
- θb/hc = contact angle of the brine-hydrocarbon-solid system
- θa/m = contact angle of the air-mercury-solid system
Ideally, values for brine-hydrocarbon contact angle, surface tension, and fluid densities at reservoir temperature and pressure should be determined in the laboratory using actual reservoir fluids. However, these measurements are difficult and expensive, so approximations such as those given in Tables 2 and 3 are commonly used.
| System | Interfacial tension σ [dyn/cm3] | |
|---|---|---|
| Air–brine | 0° | 72 |
| Air–mercury | 140° | 480 |
| Crude oil–water | 0° | 35 |
* Contact angle is measured on a quartz plane during drainage
| Fluid | Density range ρ [g/cm3] |
|---|---|
| Gas | 0.00073 to 0.50 |
| Oil | 0.50 to 1.0 |
| Brine | 1.0 to 1.2 |
Height above the free water level[edit]
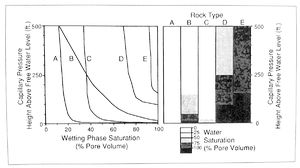
Having converted the capillary pressure data to the hydrocarbon-brine system of the reservoir and knowing the hydrocarbon and brine densities from laboratory analysis, we can now calculate the amount of hydrocarbon column required (height above the free water level or level where Pc = 0) to attain a pressure of interest:
where
- h = height above the free water level (in ft)
- Pc = hydrocarbon-brine capillary pressure (in psi)
- ρb = specific density of brine at ambient conditions (in gm/cm3)
- ρhc = specific density of hydrocarbons at ambient conditions (in gm/cm3)
- 0.433 = the gradient of pure water at ambient conditions
This information can be used to compare expected fluid saturations of different rock types at given levels in the reservoir (Figure 5). (For information on the application of capillary pressure data to evaluating fluid contacts.
Evaluating seal capacity[edit]
If the capillary pressure data from the suspected seal are available or can be estimated, the maximum hydrocarbon column each rock type could have before the seal begins leaking can be calculated by the following:
where
- hmax = height of the hydrocarbon column (in feet)
- PdS = brine-hydrocarbon displacement pressure of the seal (in psi)
- PdR = brine-hydrocarbon displacement pressure of the reservoir rock (in psi)
It is difficult to determine the displacement pressure (Pd) of a top seal.
- First, seal capacity is based on the presence of a single, continuous, high-Pd layer, not upon an arithmetic average of all Pd values. The trapping capacity is determined by the highest displacement pressure within a seal, theoretically even if that interval is a layer only one grain thick. A 500-m-thick siltstone may appear incapable of trapping more than length::1 m of hydrocarbon. The presence of a 1-cm-thick claystone layer, however, may create a seal for thousands of meters of hydrocarbon. Predicting these local seals is difficult and adds a measure of risk to any evaluation of intact top seals using capillary theory.
- Second, experiments demonstrate that hydrocarbon migration through a seal does not occur along a broad, uniform front but along narrow fingers reflecting local, tortuous pathways of low displacement pressure.[3][4]
These tortuous pathways develop even in bead packs of uniform, closely packed glass spheres. Natural seals are even more heterogeneous.
The difficulty of defining these narrow zones during sampling complicates our ability to predict the critical displacement pressure of a seal. Although 99% of the samples from a trap may indicate a top seal capable of trapping a 500-m oil column, the seal may well leak through a narrow pathway only centimeters in diameter.
Additional applications[edit]
Capillary pressure data can also be applied to help distinguish reservoir from nonreservoir and pay from nonpay (see Effective pay determination). Several workers have attempted to correlate capillary pressure data and brine or air permeabilities. Purcell related capillary pressures empirically to air permeability through the graphical integral of the curve of mercury saturation versus reciprocal capillary pressure squared. Swanson[5] proposed a simple nomograph whose application improved estimation of brine permeability from capillary pressure measurements on sidewall cores and ditch cuttings.
Another type of mercury test involves injecting mercury to a saturation less than the maximum, withdrawing the mercury to some residual wetting phase saturation, and then reinjecting the mercury. This process, repeated several times to progressively higher maximum pressures, produces hysteresis loops. These loops, wherein mercury is partially withdrawn and then reinjected, can be used to investigate withdrawal efficiency at various initial saturations.[6] [7] [1] [2] [8] Results suggest that the higher the initial saturation of the nonwetting phase, the greater the withdrawal efficiency. Porosimetry uses hysteresis loops to interpret pore body and pore throat size distributions and their partial arrangement.[9] [8] Pore sizes have also been evaluated with rate-controlled mercury injection.[10]
It should be noted that although these more specialized procedures are quite informative, especially for approximating hydrocarbon recovery efficiencies, they are also relatively labor intensive and expensive when compared to routine mercury injection tests.
See also[edit]
- Relative permeability and pore type
- Wettability
- Oil and condensate analysis
- Oilfield water analysis
- Permeability
- Overview of routine core analysis
- Core-log transformations and porosity-permeability relationships
- Rock-water reaction
References[edit]
- ↑ 1.0 1.1 1.2 Wardlaw, N. C., and R. P. Taylor, 1976, Mercury capillary pressure curves and the interpretation of pore structures and capillary behavior in reservoir rocks: Bulletin of Canadian Petroleum Geology, v. 24, p. 225-262.
- ↑ 2.0 2.1 Wardlaw, N. C., and J. P. Cassan, 1978, Estimation of recovery efficiency by visual observation of pore systems in reservoir rocks: Bulletin of Canadian Petroleum Geology, v. 26, p. 572-585.
- ↑ Dembecki, H., Jr., Anderson, M., J., 1989, Secondary migration of oil: experiments supporting efficient movement of separate, buoyant oil phase along limited conduits: AAPG Bulletin, vol. 73, no. 8, p. 1018–1021.
- ↑ CatalanXiaown, L., F., Chatzis, I., Dullien, F., A., L., 1992, An experimental study of secondary oil migration: AAPG Bulletin, vol. 76, no. 5, p. 638–650.
- ↑ Swanson, R. G., 1981, Sample examination manual: AAPG Methods in Exploration 1, 35 p.
- ↑ Morrow, N. R., 1970, Irreducible wetting phase saturations in porous media: Chemical Engineering Science, v. 25, p. 1799-1815.
- ↑ Melrose, J. C., and C. F. Brandner, 1974, Role of capillary forces in determining microscopic displacement efficiency for oil recovery by waterflooding: Journal Canadian Petroleum Technology, v. 13, p. 54-62.
- ↑ 8.0 8.1 Wardlaw, N. C., M. McKellar, and Y. Li, 1988, Pore and throat size distribution determined by mercury porosimetry and by direct observation: Carbonates and Evaporites, v. 3, p. 1-15.
- ↑ Dullien, F. A. L., and G. K. Dhawan, 1974, Characterization of pore structure by a combination of quantitative photomicrography and mercury porosimetry: Journal Colloid and Interface Science, v. 47, p. 337-349.
- ↑ Yuan, H. H., and B. F. Swanson, 1986, Resolving pore space characteristics by rate-controlled porosimetry: 5th Symposium on Enhanced oil recovery of the Society of Petroleum Engineers and the Department of Energy, April, SPE/DOE 14892, 9 p.
External links[edit]
- Original content in Datapages
- PDF file in Datapages
- Dictionary:Capillary pressure in Sheriff's Encyclopedic Dictionary


