Difference between revisions of "Full waveform acoustic logging"
Cwhitehurst (talk | contribs) |
Cwhitehurst (talk | contribs) m (added Category:Methods in Exploration 10 using HotCat) |
||
| (20 intermediate revisions by 3 users not shown) | |||
| Line 13: | Line 13: | ||
| isbn = 0891816607 | | isbn = 0891816607 | ||
}} | }} | ||
| − | Full waveform acoustic logs (FWAL) provide information about the seismic and lithologic properties of a formation. Conventional acoustic logs measure only the P (compressional) wave traveltime through the rock. Full waveform acoustic logs, however, provide a large amount of other information. This includes S (shear) wave traveltime; Stoneley wave traveltime; and P, S, and Stoneley wave amplitudes. P and S wave traveltimes and amplitudes provide information about the lithology and the fluid content of the formation. Stoneley wave velocity and amplitude have been shown to be useful in the detection of fractures and the estimation of relative formation [[permeability]]. | + | Full waveform [http://wiki.seg.org/wiki/Dictionary:Acoustic_log acoustic logs] (FWAL) provide information about the seismic and lithologic properties of a formation. Conventional acoustic logs measure only the P (compressional) wave traveltime through the rock. Full waveform acoustic logs, however, provide a large amount of other information. This includes S (shear) wave traveltime; [http://wiki.seg.org/wiki/Dictionary:Stoneley_wave Stoneley wave] traveltime; and P, S, and Stoneley wave amplitudes. P and S wave traveltimes and amplitudes provide information about the lithology and the fluid content of the formation. Stoneley wave velocity and amplitude have been shown to be useful in the detection of fractures and the estimation of relative formation [[permeability]]. |
==Tools== | ==Tools== | ||
| Line 23: | Line 23: | ||
==Wave types== | ==Wave types== | ||
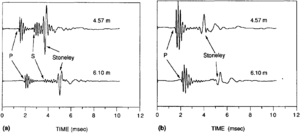
| − | [[file:full-waveform-acoustic-logging_fig1.png|thumb| | + | [[file:full-waveform-acoustic-logging_fig1.png|thumb|300px|{{figure number|1}}FWAL microseismograms recorded (a) at two source-receiver separations and (b) In a “soft” formation at two source-receiver separations.]] |
| − | There are three wave arrivals that can easily be identified in a full waveform acoustic log.<ref name=pt07r6>Cheng, C. H., | + | There are three wave arrivals that can easily be identified in a full waveform acoustic log.<ref name=pt07r6>Cheng, C. H., and M. N. Toksöz, 1981, Elastic wave propagation in a fluid-filled borehole and synthetic acoustic logs: Geophysics, v. 46, p. 1042–1053, DOI: 10.1190/1.1441242.</ref> In order of arrival time, they are the P wave packet, the S wave packet, and the Stoneley wave ([[:file:full-waveform-acoustic-logging_fig1.png|Figure 1a]]). The first two are analogs of the compressional and shear head waves refracted along the borehole wall. In a “soft” formation where the shear wave velocity is lower than the acoustic velocity of the borehole fluid (such as in semiconsolidated sediments), there is no refracted S wave arrival ([[:file:full-waveform-acoustic-logging_fig1.png|Figure 1b]]). The ''Stoneley wave'' is a pressure pulse created by the wave guide effect of the borehole and is called the ''tube wave'' in checkshot surveys or vertical seismic profiling surveys. Because the wavelength of the pressure pulse is approximately the size of the borehole diameter, there is a significant borehole wave guide effect. Thus, the refracted P and S wave arrivals along the borehole or formation boundary are not pure P and S waves. However, the first arrivals from these packets still travel with the formation P and S wave velocities, respectively.<ref name=pt07r6 /><ref name=pt07r45>Paillet, F. L., and J. E. White, 1982, Acoustic modes of propogation in the borehole and their relationship to rock properties: Geophysics, v. 47, p. 1215–1228, DOI: 10.1190/1.1441384.</ref> The amplitudes of these waves are affected by a combination of the formation P and S wave attenuation and that of the borehole fluid. The Stoneley wave travels with a velocity that is slower than both the formation shear wave velocity and the acoustic velocity of the borehole fluid. |
==Dataprocessing== | ==Dataprocessing== | ||
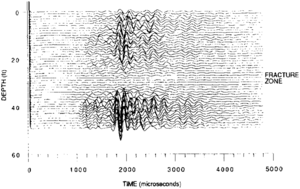
| − | + | [[file:full-waveform-acoustic-logging_fig2.png|thumb|300px|{{figure number|2}}FWAL microseismograms across a fracture zone.]] | |
| − | In a “soft” formation where the S wave velocity is lower than the acoustic velocity of the borehole fluid, no refracted S wave can be detected. The S wave slowness can be estimated indirectly using the Stoneley wave slowness,<ref name=pt07r56>Stevens, J. L., | + | With some FWAL tools, the slowness (inverse velocity or time needed to travel a fixed distance) is obtained the same way as in conventional sonic tools by picking the P wave arrival using a threshold detection algorithm and measuring the moveout between two receivers.<ref name=pt07r63>Willis, M. E., and M. N. Toksöz, 1983, Automatic P and S velocity determination from full waveform acoustic logs: Geophysics, v. 48. p. 1631–1644, DOI: 10.1190/1.1441444.</ref> Because of the lower frequency content, this method is not as accurate as that used with conventional sonic tools. The newer generation of FWAL tools take advantage of the larger number of receivers. Several different array processing techniques are used, the most common being semblance stacking along different slownesses.<ref name=pt07r29>Kimball, C. V., and T. L. Marzetta, 1984, Semblance processing of borehole acoustic array data: Geophysics, v. 49, p. 274–281, DOI: 10.1190/1.1441659.</ref> <ref name=pt07r22>Hsu, K., and A. B. Baggeroer, 1986, Application of the maximum likelihood method (MLM) for sonic velocity logging: Geophysics, v. 51, p. 780–787, DOI: 10.1190/1.1442130.</ref> <ref name=pt07r33>Lang, W. W., A. L. Kurkjian, J. H. McClellan, C. F. Morris, and T. W. Parks, 1987, Estimating slowness dispersion from arrays of sonic logging waveforms: Geophysics, v. 52, p. 530–544, DOI: 10.1190/1.1442322.</ref> This method can also be used to obtain the slownesses of the later arrivals, namely, the S wave and the Stoneley wave. |
| + | |||
| + | In a “soft” formation where the S wave velocity is lower than the acoustic velocity of the borehole fluid, no refracted S wave can be detected. The S wave slowness can be estimated indirectly using the Stoneley wave slowness,<ref name=pt07r56>Stevens, J. L., and S. M. Day, 1986, Shear velocity logging in slow formations using the Stoneley wave: Geophysics, v. 51, p. 137–147, DOI: 10.1190/1.1442027.</ref> but a number of factors including permeability can affect the Stoneley wave slowness.<ref name=pt07r62>Williams, D. M., J. Zemanek, F. A. Angona, C. L. Dennis, and R. L. Caldwell, 1984, The long space acoustic logging tool: Transactions of the Society of Professional Well Log Analysts 25th Annual Logging Symposium, Paper T.</ref> <ref name=pt07r3>Burns, D. R., C. H. Cheng, D. P. Schmitt, and M. N. Toksöz, 1988, [[Permeability]] estimation from full waveform acoustic logging data: The Log Analyst, v. 29, p. 112–122.</ref> The only reliable method is to use the direct shear wave logging tool.<ref name=pt07r62 /> <ref name=pt07r3 /> | ||
==Applications== | ==Applications== | ||
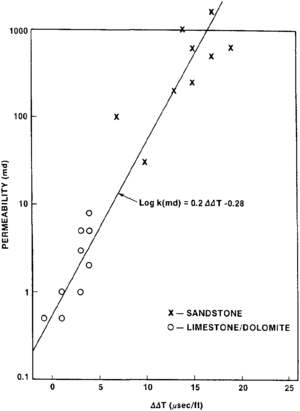
| − | + | [[file:full-waveform-acoustic-logging_fig3.png|thumb|300px|{{figure number|3}}Plot of the difference between the measured slowness and the predicted elastic slowness (ΔΔT) against the core measured permeability values for both the [[limestone]]-[[dolomite]] and the sand-shale examples. (After Burns et al.<ref name=pt07r3 />)]] | |
| − | |||
| − | |||
| − | [[ | + | The most direct use of FWAL is the measurement of formation shear wave velocity. Together with P wave velocity and density, one can obtain the shear modulus and compressibility of the formation, which are very important in engineering applications. P wave to S wave velocity ratio is a good indicator for lithology, and borehole S wave velocity information is necessary for tie-in with shear wave reflection profiles, amplitude versus [[offset]] studies, and elastic wave equation migrations, among many other uses. |
| − | + | The FWAL is also commonly used to identify and characterize fractures. Fractures are easily identified by a significant attenuation in all the wave modes—P, S, and Stoneley. An example of data across a fracture zone is shown in [[:file:full-waveform-acoustic-logging_fig2.png|Figure 2]]. Various models are available to estimate the permeability of the fracture from the Stoneley wave attenuation across a fracture<ref name=pt07r44>Paillet, F. L., 1983, Acoustic characterization of fracture permeability at Chalk River, Ontario, Canada: Canadian Geotechnical Journal, v. 20, p. 468–476, DOI: 10.1139/t83-055.</ref> <ref name=pt07r57>Tang, X. M., and C. H. Cheng, 1989, A dynamic model for fluid flow in open borehole fractures: Journal of Geophysical Research, v. 94, p. 7567–7576, DOI: 10.1029/JB094iB06p07567.</ref> and reflection from a fracture.<ref name=pt07r21>Hornby, B. E., D. L. Johnson, K. W. Winkler, and R. A. Plumb, 1989, Fracture evaluation using reflected Stoneley wave arrivals: Geophysics, v. 54, p. 1274–2188, DOI: 10.1190/1.1442587.</ref> | |
| − | [[file:full-waveform-acoustic-logging_fig3.png| | + | Similar to fractures, the FWAL can also be used to identify and characterize permeable zones.<ref name=pt07r62 /> <ref name=pt07r3 /> Stoneley wave velocity decreases and attenuation increases with formation permeability. These changes can be attributed to the interaction between the pore fluid and borehole fluid.<ref name=pt07r50>Rosenbaum, J. H., 1974, Synthetic microseismograms— logging in porous formations: Geophysics, v. 39, p. 14–32, DOI: 10.1190/1.1440407.</ref> A correlation between core measured permeability and change in Stoneley wave slowness for two different formations is shown in [[:file:full-waveform-acoustic-logging_fig3.png|Figure 3]]. |
==See also== | ==See also== | ||
| Line 61: | Line 61: | ||
* [[Marine seismic data acquisition]] | * [[Marine seismic data acquisition]] | ||
* [[Introduction to geophysical methods]] | * [[Introduction to geophysical methods]] | ||
| − | * [[ | + | * [[Seismic data - mapping with two-dimensional data]] |
* [[Seismic inversion]] | * [[Seismic inversion]] | ||
* [[Checkshots and vertical seismic profiles]] | * [[Checkshots and vertical seismic profiles]] | ||
| Line 76: | Line 76: | ||
[[Category:Geophysical methods]] | [[Category:Geophysical methods]] | ||
| + | [[Category:Methods in Exploration 10]] | ||
Latest revision as of 20:47, 19 January 2022
| Development Geology Reference Manual | |

| |
| Series | Methods in Exploration |
|---|---|
| Part | Geophysical methods |
| Chapter | Full waveform acoustic logging |
| Author | C. H. Cheng |
| Link | Web page |
| Store | AAPG Store |
Full waveform acoustic logs (FWAL) provide information about the seismic and lithologic properties of a formation. Conventional acoustic logs measure only the P (compressional) wave traveltime through the rock. Full waveform acoustic logs, however, provide a large amount of other information. This includes S (shear) wave traveltime; Stoneley wave traveltime; and P, S, and Stoneley wave amplitudes. P and S wave traveltimes and amplitudes provide information about the lithology and the fluid content of the formation. Stoneley wave velocity and amplitude have been shown to be useful in the detection of fractures and the estimation of relative formation permeability.
Tools
Full waveform acoustic logging tools are similar to conventional acoustic logging tools. The main differences are that (1) the source is usually of lower frequency, centered at 5 to 10 kHz rather than at 20 kHZ; (2) the source-receiver spacing is longer, on the order of length::10 ft (3.05 m); and (3) the receiver is commonly an array consisting of four to twelve phones.
The source generates a pressure pulse. Seismic waves propagating down the borehole are recorded by the receivers. Instead of just the first arrival, the whole wavetrain traveling down the borehole is recorded and digitized, with the typical digitization interval being 5 μsec. The length of the time window recorded varies from 2 to 10 msec, depending on the source-receiver separations.[1]
Wave types
There are three wave arrivals that can easily be identified in a full waveform acoustic log.[2] In order of arrival time, they are the P wave packet, the S wave packet, and the Stoneley wave (Figure 1a). The first two are analogs of the compressional and shear head waves refracted along the borehole wall. In a “soft” formation where the shear wave velocity is lower than the acoustic velocity of the borehole fluid (such as in semiconsolidated sediments), there is no refracted S wave arrival (Figure 1b). The Stoneley wave is a pressure pulse created by the wave guide effect of the borehole and is called the tube wave in checkshot surveys or vertical seismic profiling surveys. Because the wavelength of the pressure pulse is approximately the size of the borehole diameter, there is a significant borehole wave guide effect. Thus, the refracted P and S wave arrivals along the borehole or formation boundary are not pure P and S waves. However, the first arrivals from these packets still travel with the formation P and S wave velocities, respectively.[2][3] The amplitudes of these waves are affected by a combination of the formation P and S wave attenuation and that of the borehole fluid. The Stoneley wave travels with a velocity that is slower than both the formation shear wave velocity and the acoustic velocity of the borehole fluid.
Dataprocessing
With some FWAL tools, the slowness (inverse velocity or time needed to travel a fixed distance) is obtained the same way as in conventional sonic tools by picking the P wave arrival using a threshold detection algorithm and measuring the moveout between two receivers.[4] Because of the lower frequency content, this method is not as accurate as that used with conventional sonic tools. The newer generation of FWAL tools take advantage of the larger number of receivers. Several different array processing techniques are used, the most common being semblance stacking along different slownesses.[5] [6] [7] This method can also be used to obtain the slownesses of the later arrivals, namely, the S wave and the Stoneley wave.
In a “soft” formation where the S wave velocity is lower than the acoustic velocity of the borehole fluid, no refracted S wave can be detected. The S wave slowness can be estimated indirectly using the Stoneley wave slowness,[8] but a number of factors including permeability can affect the Stoneley wave slowness.[9] [10] The only reliable method is to use the direct shear wave logging tool.[9] [10]
Applications
The most direct use of FWAL is the measurement of formation shear wave velocity. Together with P wave velocity and density, one can obtain the shear modulus and compressibility of the formation, which are very important in engineering applications. P wave to S wave velocity ratio is a good indicator for lithology, and borehole S wave velocity information is necessary for tie-in with shear wave reflection profiles, amplitude versus offset studies, and elastic wave equation migrations, among many other uses.
The FWAL is also commonly used to identify and characterize fractures. Fractures are easily identified by a significant attenuation in all the wave modes—P, S, and Stoneley. An example of data across a fracture zone is shown in Figure 2. Various models are available to estimate the permeability of the fracture from the Stoneley wave attenuation across a fracture[11] [12] and reflection from a fracture.[13]
Similar to fractures, the FWAL can also be used to identify and characterize permeable zones.[9] [10] Stoneley wave velocity decreases and attenuation increases with formation permeability. These changes can be attributed to the interaction between the pore fluid and borehole fluid.[14] A correlation between core measured permeability and change in Stoneley wave slowness for two different formations is shown in Figure 3.
See also
- Seismic data acquisition on land
- Seismic interpretation
- Cross-borehole tomography in development geology
- Synthetic seismograms
- Vertical and lateral seismic resolution and attenuation
- Forward modeling of seismic data
- Borehole gravity
- Displaying seismic data
- Three-dimensional seismic method
- Magnetics
- Electrical methods
- Seismic migration
- Basic seismic processing
- Marine seismic data acquisition
- Introduction to geophysical methods
- Seismic data - mapping with two-dimensional data
- Seismic inversion
- Checkshots and vertical seismic profiles
- Amplitude versus offset (AVO) analysis
- The gravity method
References
- ↑ Minear, J. W., 1986, Full wave sonic logging—a brief perspective: Transactions of the Society of Professional Well Log Analysts 27th Annual Logging Symposium, Paper AAA.
- ↑ 2.0 2.1 Cheng, C. H., and M. N. Toksöz, 1981, Elastic wave propagation in a fluid-filled borehole and synthetic acoustic logs: Geophysics, v. 46, p. 1042–1053, DOI: 10.1190/1.1441242.
- ↑ Paillet, F. L., and J. E. White, 1982, Acoustic modes of propogation in the borehole and their relationship to rock properties: Geophysics, v. 47, p. 1215–1228, DOI: 10.1190/1.1441384.
- ↑ Willis, M. E., and M. N. Toksöz, 1983, Automatic P and S velocity determination from full waveform acoustic logs: Geophysics, v. 48. p. 1631–1644, DOI: 10.1190/1.1441444.
- ↑ Kimball, C. V., and T. L. Marzetta, 1984, Semblance processing of borehole acoustic array data: Geophysics, v. 49, p. 274–281, DOI: 10.1190/1.1441659.
- ↑ Hsu, K., and A. B. Baggeroer, 1986, Application of the maximum likelihood method (MLM) for sonic velocity logging: Geophysics, v. 51, p. 780–787, DOI: 10.1190/1.1442130.
- ↑ Lang, W. W., A. L. Kurkjian, J. H. McClellan, C. F. Morris, and T. W. Parks, 1987, Estimating slowness dispersion from arrays of sonic logging waveforms: Geophysics, v. 52, p. 530–544, DOI: 10.1190/1.1442322.
- ↑ Stevens, J. L., and S. M. Day, 1986, Shear velocity logging in slow formations using the Stoneley wave: Geophysics, v. 51, p. 137–147, DOI: 10.1190/1.1442027.
- ↑ 9.0 9.1 9.2 Williams, D. M., J. Zemanek, F. A. Angona, C. L. Dennis, and R. L. Caldwell, 1984, The long space acoustic logging tool: Transactions of the Society of Professional Well Log Analysts 25th Annual Logging Symposium, Paper T.
- ↑ 10.0 10.1 10.2 10.3 Burns, D. R., C. H. Cheng, D. P. Schmitt, and M. N. Toksöz, 1988, Permeability estimation from full waveform acoustic logging data: The Log Analyst, v. 29, p. 112–122.
- ↑ Paillet, F. L., 1983, Acoustic characterization of fracture permeability at Chalk River, Ontario, Canada: Canadian Geotechnical Journal, v. 20, p. 468–476, DOI: 10.1139/t83-055.
- ↑ Tang, X. M., and C. H. Cheng, 1989, A dynamic model for fluid flow in open borehole fractures: Journal of Geophysical Research, v. 94, p. 7567–7576, DOI: 10.1029/JB094iB06p07567.
- ↑ Hornby, B. E., D. L. Johnson, K. W. Winkler, and R. A. Plumb, 1989, Fracture evaluation using reflected Stoneley wave arrivals: Geophysics, v. 54, p. 1274–2188, DOI: 10.1190/1.1442587.
- ↑ Rosenbaum, J. H., 1974, Synthetic microseismograms— logging in porous formations: Geophysics, v. 39, p. 14–32, DOI: 10.1190/1.1440407.


