Diagenetically complex reservoir evaluation
| Development Geology Reference Manual | |
| |
| Series | Methods in Exploration |
|---|---|
| Part | Geological methods |
| Chapter | Evaluating diagenetically complex reservoirs |
| Author | Michael D. Wilson |
| Link | Web page |
| Store | AAPG Store |
Major variations in levels of reservoir quality and degrees of lateral and vertical continuity within oil and gas fields are controlled primarily by depositional factors. However, major inhomogeneities may also be produced by diagenetic alterations. These inhomogeneities in rock properties may transect or reverse trends produced by depositional controls and can significantly influence reservoir properties, including initial fluid saturations, residual saturations, waterflood sweep efficiencies, preferred directions of flow, and reactions to injected fluids. Extreme permeability stratification or the development of permeability barriers by diagenetic alteration may lead to the need to drill additional infill wells or reposition the locations of such wells, selectively perforate and inject reservoir units, manage zones on an individual basis, and revise decisions regarding suitability for thermal recovery operations.
A diagenetically complex reservoir is a reservoir in which the major inhomogeneities affecting fluid distribution and/or productivity are controlled primarily by diagenetic events. Diagenetic inhomogeneities are zones of reduced or enhanced porosity and/or permeability that are generated by one or a combination of the processes of cementation, compaction, replacement, dissolution, and fracturing. For a reservoir to be considered complex, the diagenetic inhomogeneities must exhibit a complex distribution that is not directly correlated with or controlled by depositional factors.
Diagenetic events that create reservoir heterogeneities[edit]
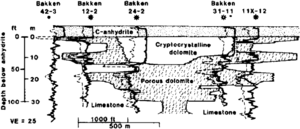
Diagenetic alterations are defined here as all physical and chemical alterations that affect a sediment subsequent to deposition, including tectonically produced fractures and faults. Diagenetic alterations that have been observed to generate reservoir heterogeneities having a major influence on reservoir rock properties are shown in Table 1. In sandstone reservoirs, carbonate and anhydrite cementation, clay authigenesis, secondary porosity generation, and fracturing are the most commonly reported alterations. In carbonate reservoirs, the diagenetic components most often observed are gypsum/anhydrite cementation, dolomite replacement, secondary porosity generation, and stylolitization. A cross section from Longman[1] illustrates the complexity of porosity development in one of the few well-documented examples of a diagenetically complex reservoir (Figure 1).
| Diagenetic Component | Field | Reference |
|---|---|---|
| Cementation | ||
| Siderite | C Unit, Kuparuk Field, Alaska | [2] |
| Dolomite | Oregon basin Field, Wyoming | [3] |
| Anhydrite | Pierce and Black Hollow Fields, Colorado | [4] |
| Authigenic clays | Hankensbuttel-Sud Field, Germany | [5] |
| Stylolitization and associated cementation | Dukhan Field, Qatar | [6] |
| Dissolution | ||
| Carbonate | Spindle Field, Colorado | [7] |
| Anhydrite | Howard-Glasscock Field, Texas | [8] |
| Dolomite replacement | Crane Field, Montana | [1] |
| Faulting/fracturing | Anschutz Ranch Field, Wyoming | [9] |
Zones of cementation, dissolution, and replacement may exhibit a wide variety of distributions. To prepare an accurate reservoir description, the geologist needs to understand the diagenetic processes, and the controls on these processes, which generated the heterogeneities present in the reservoir under investigation.
Reservoir description methodology[edit]
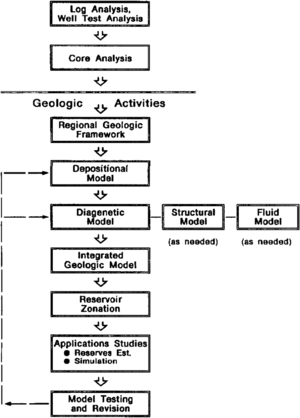
A schematic diagram illustrating the basic stages of reservoir description in a diagenetically complex reservoir is shown in Figure 2. Geological activities follow the stages of well data analysis and core analysis, which constitute basic input to the geological phase of the analysis.
Stage 1. Construction of a regional geological framework[edit]
To assist in the understanding of the depositional and diagenetic events that have created and modified the reservoir rocks, analysis of the regional geological framework can be very helpful. Elements of the regional geology most useful for this include regional thickness and lithofacies patterns, the plate tectonic history of the area, the local structural history, the history of exploration and production in the area, the burial history including major erosional and/or nondepositional events, and in particular, the thermal and pressure history of the reservoir.
Stage 2. Construction of a depositional model[edit]
The first stage of reservoir description is the preparation of a depositional model that depicts the vertical and lateral variations in depositional environment as reflected in lithologies, textural properties, fossil content, and sedimentary structures (see Lithofacies and environmental analysis of clastic depositional systems and Carbonate reservoir models: facies, diagenesis, and flow characterization). This is necessary to assess the degree of heterogeneity attributable to depositional factors and the relative importance of depositional controls on major diagenetic alterations.
Stage 3. Construction of a diagenetic model[edit]
In this stage, the geologist must prepare a model that depicts the major vertical and lateral variations in diagenetic alteration as reflected in the abundances of cementing agents and/or extent of recrystallization, dissolution, replacement, and fracturing.
Step 1. Basic rock description[edit]
The geologist first collects data relating to the relative abundance of diagenetic components recognizable at the magnification levels of a binocular microscope or handlens. This evaluation may be conducted simultaneously with the rock description step of depositional model construction. The most useful data are derived from slabbed full diameter cores, but recourse to cuttings and sidewall cores is necessary where such cores are not available. In addition to describing the slabbed core, horizontal core plugs used for core analysis measurements should also be described. Recent advances in the methodology of cuttings analysis involve visual aids such as cuttings comparators, low magnification (20×) photographs of cuttings samples, thin section photomicrographs, and scanning electron microscope (SEM) micrographs of rock chips and pore casts. These allow more extensive utilization of these samples for rock characterization.[10]
Step 2. Quantitative analysis[edit]
Semiquantitative and/or quantitative analyses of the abundance of diagenetic components are generally performed using the standard techniques of thin section petrography, X-ray diffraction (XRD), and scanning electron microscopy (see SEM, XRD, CL, and XF methods). The objective of these analyses is to establish the types, abundances, and distributions of the various framework, pore, and pore-filling components as well as to determine the temporal sequence of diagenetic alterations (paragenesis). Table 2 lists the primary techniques and their areas of application as well as similar information for supplementary and alternative techniques where factors of speed, cost, or available manpower or expertise prevent use of standard techniques.
| Technique | Application |
|---|---|
| Primary Techniques | |
| Thin section petrography | Mineral types and abundances; pore types and abundances; diagenetic sequence; texture (size, sorting) |
| X-ray diffraction | Mineral types and abundances |
| Scanning electron microscopy | Pore network characteristics; diagenetic sequence |
| Supplementary and Alternative Techniques | |
| Fourier transform infrared spectroscopy | Mineral types and abundances |
| Cathodoluminescence microscopy | Recognition of subtle or hidden diagenetic features; diagenetic sequence |
| Isotope geochemistry | Interpretation of paleosalinity and paleotemperatures |
| Fluorescence microscopy | Recognition of depositional and diagenetic components and textures in dolomitized or recrystallized limestone; porosity estimation |
| Image analysis | Pore network characterization; grain size and morphology; mineral types and abundances (in combination with SEM or microprobe analysis) |
| Fluid inclusions | Temperatures and pressures of formation of surrounding crystal; composition of fluids involved in diagenesis |
| Chemostratigraphy | Correlation of apparently homogeneous sequences |
| Fission track thermometry | Thermal history analysis |
| Radiometric dating | Age dating of diagenetic events |
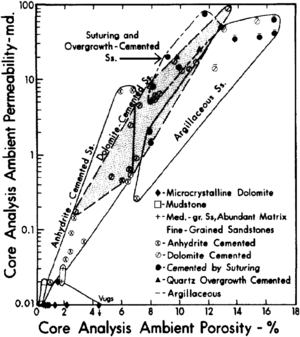
Sample sites for petrographic analysis are best selected on the basis of low magnification rock descriptions generated in step 1 and through examination of semilog porosity-permeability cross plots (Figure 3) with values keyed to major categories of size, sorting, matrix content, cement content, or pore type, depending on their relative importance in a particular reservoir. Samples should be selected to span a wide range of porosities and permeabilities for each major type of reservoir rock (for example, sandstones that are dolomite cemented, anhydrite cemented, quartz-overgrowth cemented, or argillaceous).
Use of plug ends from homogeneous horizontal core analysis plugs for thin section, XRD, or SEM sample preparation allows for the development of quantitative relationships between data from these analyses and data from core analysis measurements. Plugs containing significant inhomogeneities, such as laminae of distinctly different grain size or degrees of cementation, should be avoided or else erroneous variance in the data set will tend to blur what otherwise might be easily recognizable clear-cut relationships.
Zones having obviously low or high permeability as a result of their grain size, sorting, clay content, cement content, or extent of dissolution or fracturing, but which were not represented in the original suite of core plugs, should be sampled to evaluate their influence on flow properties. It is also important to assess the degree of vertical permeability across small scale potential permeability barriers such as stylolites, cemented zones, and healed fractures. If full diameter core analysis was conducted, a representative portion of each segment can be selected for analysis, and the porosity-permeability measurements for the whole segment can be assumed to apply to the portion sampled. Alternatively, core analysis and rock descriptive work can be conducted on plugs cut in selected segments of the full diameter core.
Petrographic analysis should be designed to generate quantitative data. Decisions as to which components should be measured separately in this analysis are based on several criteria. Generally, components that are relatively abundant (>10%) and whose abundance varies significantly in the interval being investigated should be measured separately. Porosity-permeability crossplots on which samples are plotted according to lithological data obtained from binocular microscope analysis may reveal relationships indicating the relative importance of certain components (Figure 3). Components that are finely crystalline, particularly diagenetic clays, may exert a major effect on permeability, even where their abundances are relatively low (3–5%).
Quantitative point count analysis is preferable to semiquantitative visual estimation. If such analyses are not feasible, use should be made of visual comparators. If microcrystalline components having sizes
Step 3. Lithology-log response analysis[edit]
If continuous core is available, analysis can proceed directly to the preparation and correlation of vertical component profiles (steps 4 and 5). However, in many reservoirs, particularly those with thick gross pay intervals, core or sidewall core coverage is limited to only a few wells or intervals. To complete the lithological analysis, the geologist must resort to cuttings descriptions or log analysis (see Quick-look lithology from logs). Commonly, the degree of detail that can be extracted from cuttings samples is not adequate for the objectives of the study, so the geologist must attempt to correlate log response with lithological data from intervals containing full diameter or sidewall cores and then apply these correlations to uncored intervals.
Step 4. Diagenetic profile construction[edit]
Once the lithological data for all wells involved in the study have been gathered, vertical profiles of diagenetic component abundance should be prepared. Only components having a significant effect on reservoir quality should be profiled. In some instances, components measured separately but having similar overall effects on reservoir properties can be combined to form one profile.
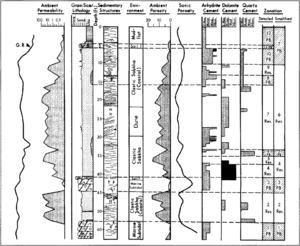
If the abundances of the major diagenetic components are based strictly on visual estimation using a binocular microscope, qualitative (very minor, minor, moderate, or abundant) or semiquantitative (0–5%, 5–10%, or 10–15%) bar profiles can be prepared displaying sedimentological and petrophysical data (Figure 4). Where quantitative petrographic data are collected, they can replace the original bar profile data.
Step 5. Continuity analysis[edit]
The objective of this step is to prepare a model that describes the three-dimensional distribution of the major diagenetic components represented on the vertical well profiles. The accuracy of and confidence in these correlations are governed by such factors as (1) the uniqueness of the profiles constructed, (2) the degree of heterogeneity within the reservoir (see Geological heterogeneities), (3) the degree to which the sample coverage in each well represents the variations present within the reservoir, (4) how well the geologist understands the origins of and factors controlling the distribution of the major diagenetic alterations, (5) the well spacing, and (6) the thicknesses of the diagenetic zones.
Although some diagenetic components may display abundance trends that follow or are only slightly discordant with depositional trends, others may occur at large angles to the latter. Some of the more common distributions of diagenetic components and the geological factors controlling these distributions are listed in Table 3.
| Distribution | Origin |
|---|---|
| Cementation at top and/or base of reservoir sandstone | Pressure and/or temperature decreases in fluids compacted out of bordering shale beds |
| Cementation or dissolution along or in close proximity to fractures or faults or in zones in communication with such features | Fluids moving along avenues of pressure release precipitate material or react with adjacent rocks |
| Cementation in zones that represent concentrations of chemically unstable detrital particles | Variations in sedimentological conditions produce local concentrations of grains that dissolve and reprecipitate as cementing material |
| Zones of cementation or dissolution follow lamina having specific textural properties | Migrating fluids are preferentially concentrated in highly permeable units or, under evaporitic conditions, in relatively fine units where capillary properties favor their retention |
| Dissolution occurs in close proximity to major or minor unconformities | Invasion of fresh meteoric waters favors extensive dissolution and/or mineral alterations (e.g., kaolinitization of precursor clays or micas) |
| Dissolution occurs at crest of anticline or at updip pinchout of a reservoir unit | CO2 and/or organic acids generated during thermal maturation of organics seek structural or stratigraphic highs and generate acidic conditions |
| Increased cementation occurs below oil-water or gas-water contacts | Early stage emplacement of oil or gas retards diagenetic alterations in the zone saturated with hydrocarbons |
| Zones of increased cementation are facies selective and tend to follow zones reflecting specific subenvironments | More extensive rates of evaporation in sabkha environments or more extensive pressure solution in low energy argillaceous zones |
| Increased cementation occurs at positions of paleowater tables | Increased evaporative precipitation occurs at or just above positions of paleowater tables if solutions are supersaturated; dissolution occurs just below if solutions are undersaturated |
| Increased calcite/aragonite cementation in shallow marine phreatic zone where steep slopes or high energy conditions occur | Conditions favorable to precipitation of calcite and aragonite include areas where CO2 degassing occurs, certain bacteria are present, and photosynthesis and/or respiration of reef organisms increase the pH of pore waters to values greater than 9 |
The basic correlation techniques in common use include marker and sequence analysis and, where continuity is very limited, slice techniques.[11] Correlation of diagenetic zones is most accurate when the origins and timings of the diagenetic events creating the components of interest are well understood, the sample and well spacing are relatively small, the diagenetic zones are relatively thick, and the sequence of zones is unique.
The distribution of reservoir fluids or pressures at the time of discovery of the reservoir, or at subsequent intervals during field development, may indicate the presence of continuous permeability barriers and thus may help to confirm the extent of some diagenetic zones. When the basic correlation techniques prove unsatisfactory or inadequate due to a high degree of complexity or low degree of confidence, the geologist may need to resort to special engineering techniques such as pulse testing [12] or tracer studies [13] (Table 4), or to probabilistic modeling Cite error: Invalid <ref> tag; invalid names, e.g. too many (see Integrated computer methods).
| Technique | Advantages | Disadvantages |
|---|---|---|
| Diagenetic profile correlation | Rapid once basic data are collected; relatively inexpensive | May not provide unique solution; limited to zones with full-diameter and sidewall core coverage; degree of confidence low if zones correlated are thin or well spacing is large |
| Log correlation | Rapid; inexpensive | May not provide unique solution; results dependent on ability to correlate lithology to unique log response Degree of confidence low if zones correlated are thin or well spacing is large Requires modern log suite (GR, density, neutron, or sonic) |
| Fluid distribution | Rapid; inexpensive | Generally useful only over limited intervals and only in a few reservoirs |
| Pressure distribution | Rapid; inexpensive | Generally useful only over limited intervals and only in a few reservoirs |
| Transient and pulse testing | Provide information on reservoir connectivity, storage, transmissibility, and hydraulic diffusivity | Expensive; commonly does not provide unique solutions |
| Tracer tests | Provides information on volumetric sweep, directional flow, flow barrier distribution and fluid velocity | Expensive; generally limited to closely spaced wells; slow |
| Three-dimensional seismic | Provides essentially continuous profiling across area of investigation | Resolution limited; expensive; interpretation may be difficult; may not provide unique interpretation |
Preparation of contour maps for pertinent diagenetic components may assist in the evaluation of zone continuity (see Subsurface maps). However, the merging of data from more than one diagenetic zone may lead to misinterpretations of the degree of continuity present. Contour maps should always be interpreted in combination with detailed correlation cross sections. Preparation of three-dimensional “spectragrams” may be helpful in visual correlation studies.
Stage 4. Preparation of an integrated geological model[edit]
Following generation of the separate depositional and diagenetic models, data from these models must be merged to form an integrated geological model. To do this, the geologist must examine the two independent models and extract those factors that constitute the major controls on porosity, permeability, and hydrocarbon saturation. It may be useful to perform statistical analysis on the data using techniques such as correlation coefficient calculations, univariate regression, and cluster analysis, or multivariate techniques such as discriminant analysis and stepwise regression (see Integrated computer methods).
In some fields, it may be necessary to prepare separate structural and formation fluid models in addition to depositional and diagenetic models (Figure 2). In most reservoirs, however, structural and formation fluid factors are not the major controls on fluid flow behavior, and the heterogeneities observed can be incorporated into the diagenetic model.
Stage 5. Reservoir zonation[edit]
In this stage, it is necessary for the geologist to subdivide each well (reservoir quality profile) into relatively homogeneous units or zones. Initially it is best to construct a relatively detailed zonation reflecting major variations in reservoir rock characteristics regardless of their vertical dimensions (Figure 4).
Zonation may be facilitated by establishing criteria by which major categories of reservoir rock types present can be distinguished. Semilog crossplots of porosity and permeability keyed to texture, matrix content, and diagenetic component content are very useful. Through examination of these plots, the geologist can quickly separate samples into natural groupings (Figure 3). Because permeability directly reflects fluid flow capacity, it is the major parameter used to designate reservoir rock categories. Because porosity is commonly a major control on permeability, it generally exhibits a positive correlation with that variable. Attempts to create hierarchies of permeability heterogeneity based strictly on depositional criteria[14] should be avoided in reservoirs where diagenetic alterations are major controls on permeability heterogeneity. If natural groupings are not present, it may be necessary to set arbitrary group boundaries, such as porosity or permeability cutoffs.
Estimation of the lateral distribution of zones is then guided by relationships developed in the integrated geological model and documented in the form of maps and cross sections.
Stage 6. Applications studies[edit]
Depending on the objectives of the study being conducted, the geologist needs to generate additional maps, cross sections, fence diagrams, or simulation models. For the purposes of reserve estimation, net pay maps are needed (see Effective pay determination). If the major controls on net pay distribution are diagenetic in nature, contouring of net pay maps should be guided by trends present on contour maps of major diagenetic components. Average porosity maps should also be “guided” in this same fashion. Where simulation of fluid flow behavior is the object of the study, the geologist must assist in the preparation of a three-dimensional simulation model.
Stage 7. Model testing and revision[edit]
Where economics dictate, it may be necessary to test the accuracy of the models developed. This can include testing by history matching of pressures, production rates, and GOR values for segments of the model or full scale testing of the complete model[15] (see Product histories and Conducting a reservoir simulation study: an overview). Testing can also involve drilling additional wells, conducting special engineering tests (pulse or tracer), and collecting geological data on additional samples. Revisions may also be required as additional wells, particularly infill wells, are drilled in the field.
See also[edit]
- Introduction to geological methods
- Flow units for reservoir characterization
- Effective pay determination
- Cross section
- Conversion of well log data to subsurface stratigraphic and structural information
- Evaluating tight gas reservoirs
- Reservoir quality
- Carbonate reservoir models: facies, diagenesis, and flow characterization
- Fluid contacts
- Geological heterogeneities
- Evaluating fractured reservoirs
- Evaluating stratigraphically complex fields
- Carbonate diagenesis
References[edit]
- ↑ 1.0 1.1 1.2 Longman, M. W., T. G. Fertal, and J. S. Glennie, 1983, Origin and geometry of Red River Dolomite reservoirs, western Williston basin: AAPG Bulletin, v. 67, p. 744–771.
- ↑ Gaynor, G. C., and M. H. Scheihing, 1988, Shelf depositional environments and reservoir characteristics of the Kuparuk River Formation (Lower Cretaceous), Kuparuk field, North Slope, Alaska, in Lomando, A. J., Harris, P. M., eds., Giant oil and gas fields—A core workshop: Society of Economic Paleontologists and Mineralogists Core Workshop 12, p. 333–389.
- ↑ Morgan, J. T., F. S. Cordiner, and A. R. Livingston, 1977, Tensleep reservoir study, Oregon Basin field, Wyoming— reservoir characteristics: Journal of Petroleum Technology, v. 29, p. 886–896, DOI: 10.2118/6141-PA.
- ↑ Levandowski, D. W., M. E. Kaley, S. R. Silverman, and R. G. Smalley, 1973, Cementation in Lyons Sandstone and its role in oil accumulation, Denver basin, Colorado: AAPG Bulletin, v. 57, p. 2217–2244.
- ↑ Gaida, K. H., D. G. Kessel, H. Volz, H., and W. Zimmerle, 1987, Geologic parameters of reservoir sandstones as applied to enhanced oil recovery: SPE Formation Evaluation, v. 2, p. 89–96, DOI: 10.2118/13570-PA.
- ↑ Dunnington, H. V., 1967, Aspects of diagenesis and shape change in stylolitic limestone reservoirs: 7th World Petroleum Congress Proceedings, v. 2, p. 339–352.
- ↑ Porter, K. W., and R. J. Weimer, 1982, Diagenetic sequence related to structural history and petroleum accumulation: Spindle field, Colorado: AAPG Bulletin, v. 66, p. 2543–2560.
- ↑ White, T. C., 1984, Dolomitization, sulfate solution, and porosity development: The San Andres Formation, Howard-Glassock field, Howard County, Texas, in AAPG Southwest Section Transactions: West Texas Geological Society Publication 84–78, p. 91–102.
- ↑ Lindquist, S. J., 1983, Nugget Formation reservoir characteristics affecting production the Overthrust Belt of southwestern Wyoming: Journal of Petroleum Technology, July, p. 1355–1365.
- ↑ Sneider, R. M., H. R. King, H. E. Hawkes, and T. B. Davis, 1983, Methods for detection and characterization of reservoir rock, Deep Basin gas area, western Canada: Journal of Petroleum Technology, Sept., p. 1725–1734.
- ↑ Cant, D. J., 1984, Subsurface facies analysis, in R. G. Walker, ed., Facies Models: Geoscience Canada, Reprint Series 1, p. 297–319.
- ↑ Pierce, A. E., 1977, Case history: Waterflood performance predicted by pulse testing, Journal of Petroleum Technology, v. 29, p. 914-918.
- ↑ Wagner, O. R., 1977, The use of tracers in diagnosing interwell reservoir heterogeneities: Field results, Journal of Petroleum Technology, v. 29, p. 1410-1416.
- ↑ Lewis, J. J. M., 1988, Outcrop-derived quantitative models of permeability heterogeneity for genetically different sand bodies: 63rd Annual SPE Technical Conference Proceedings, p.449-463, SPE #18153
- ↑ Weber, K. J., P. H. Klootwijk, J. Knoieczek, and W. R. van der Vlugt, 1978, Simulation of water injection in a barrier-bar- type, oil-rim reservoir in Nigeria: Journal of Petroleum Technology, v. 30, p. 1555–1565, DOI: 10.2118/6702-PA.
