Fractured reservoir evaluation
| Development Geology Reference Manual | |
| |
| Series | Methods in Exploration |
|---|---|
| Part | Geological methods |
| Chapter | Evaluating fractured reservoirs |
| Author | Ronald A. Nelson |
| Link | Web page |
| Store | AAPG Store |
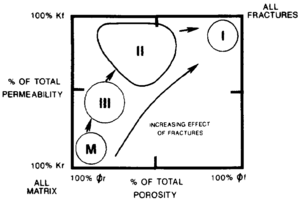
A fractured reservoir is one in which naturally occurring fractures either have or are predicted to have a significant effect on reservoir fluid flow in the form of (1) increased reservoir permeability, (2) increased porosity, and/or (3) increased permeability anisotropy. Four basic types of reservoir fractures can be defined (Figure 1):
Type 1—Provide the essential porosity and permeability to the reservoir
Type 2—Provide the essential permeability
Type 3—Provide a permeability assist to an already producible reservoir
Type 4—Impart no positive reservoir quality but create strong reservoir anisotropy and inhomogeneity[1]
Anticipated exploration and development problems associated with these four reservoir types are summarized in Table 1 and Table 2.
| Reservoir Formation Problem | Approach |
|---|---|
| Reservoir performance is controlled by sedimentary facies, lithology and/or geometry | Determine sedimentary characteristics and origin of facies through core description and construct predictive models for lateral variability and heterogeneity of reservoir units |
| Reservoir performance and formation permeabilities are negatively impacted by presence of detrital or authigenic clays (very common) | Identify and map reservoir facies with the least detrital clay content; avoid treatment of formation by acidization or injection of any fluids; use oil-based muds; enhance recovery through artificial fracturing of the formation[2] |
| Reservoir performance is dictated by origin and distribution of natural fractures | Evaluate the relationship between fracture occurrence and lithology[3] |
| Fracture mineralization impacts reservoir performance. | Determine the nature, origin, and timing of mineralization through petrographical and stable isotope techniques[3] |
| Porosity and permeability trends are controlled by clay diagenesis or secondary cements | Determine the petrological and mineralogical history of reservoir facies; identify and map “diagenetic facies” relative to sedimentary facies |
| Reservoir gas accumulations lack a floored gas-water contact | Map structural, isothermal, and pressure gradient contours that are likely coincident with boundaries of the gas envelope[4] |
| Overpressured formation or reservoir (occurs frequently due to common distribution of tight gas with basin center locations and excessive overburden) | Requires appropriate exploration strategies or reservoir engineering approach to gas recovery |
| Underpressured formation or reservoir due to stripping (erosion) of overburden | Requires appropriate exploration strategies or reservoir engineering approach to gas recovery |
| Type | Problems |
|---|---|
| Type 1. Fractures provide essential porosity and permeability | Rapid decline rate |
| Often limited reserves | |
| Rapid coning | |
| Fracture intensity and width must be very high | |
| Type 2. Fractures provide essential permeability | Poor fracture and matrix interaction can isolate matrix hydrocarbons |
| Rates often need to be controlled to not pull water preferentially along fractures and not through matrix | |
| Permeability contrast between fractures and matrix reduced sweep efficiency in flooding | |
| Development must be highly tailored to the reservoir Matrix block size should be small | |
| Type 3. Fractures provide a permeability assist | Nonrecognition of the fracture system leads to poor estimations of drainage area and reserves per well and unusual response in secondary recovery |
| Apparently isolated reservoirs are often really interconnected | |
| Fracture system must have good continuity or “connectedness” | |
| Type 4. Fractures create only permeability anisotropy | Reservoir often highly compartmentalized |
| Flow predictions from standard core or log analyses do not match reservoir performance | |
| Wells may display a larger skin factor than anticipated | |
| Best to have fractures of one orientation than multiple intersecting trends |
Evaluation
When evaluating a fractured reservoir, the analyst must follow these steps:[1]
- Determine the origin of the fracture system found or the type of fracture system that is being explored for based on geometric characteristics of the fractures, their distribution in three dimensions, and empirical models of fracture system genesis.[5]
- Determine the reservoir properties of both the rock matrix housing the fractures and the fracture system.[6]
- Determine the degree of fluid flow interaction or crossflow in either a qualitative or quantitative manner.
- Classify the fractured reservoir on the basis of what the fracture system provides to overall reservoir quality.
This evaluation should be initiated early in the life of a field and can be terminated at any time if preliminary results suggest that either the reservoir is uneconomic or that fractures appear to be a minor component of total reservoir quality.
Data acquisition
The data needed to evaluate a fractured reservoir are commonly obtained from detailed observation of reservoir cores (including their associated well logs) and relevant outcrops. Cores and core-calibrated well logs give the one-dimensional depth and lithological variation in fracturing in one position in the reservoir. Outcrops give appropriate two-dimensional variation of the reservoir in map view within individual layers. Together, a three-dimensional representation of the reservoir can be approximated and correlated with production histories.
Core and well log analysis
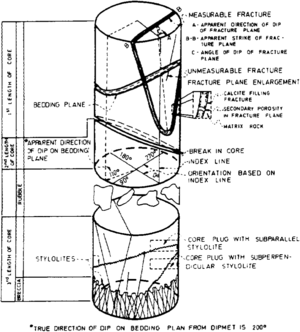
The following procedures have proven useful in fracture analyses of core (after [1]):
- Lay out all of the core from a given well for observation. Fit the core together and note continuous segments (see Core handling).
- Do initial observations while the core is clean and in its whole-core state (unslabbed) (see Core description). In this state, all fractures are present and their angular relationships retained. The core can be slabbed later and a finer internal description done at that time. Large diameter cores are generally preferred to small diameter cores. The larger diameter core depicts more regularly spaced high-angle fractures and thus gives a better representation of fracture spacing and a better measurement of reservoir properties from core analyses.
- Have the core analyses (porosity and permeability) data in hand while observing the core to determine the relative effect of the features observed. Obtain three-dimensional whole-core analyses, if possible, when the fractures or other anisotropic features are predicted to be important.
- Create the fracture stratigraphy (involves steps 5 through 16).
- Construct a core deformation strip log at a relevant scale that includes the positioning of major lithology and formation breaks, lost core and noncored intervals, oil-water or gas-water contacts] (if available), fractures, and stylolites. Hairline fractures in the core are often difficult to see. These can be enhanced by painting the core with a volatile liquid and observing the drying pattern. Overlooked fractures may “jump out” at the observer by persistence of wetting along hairline fractures reaching the core surface. Additional characterization of hairline or larger fractures internal to the core can be accomplished by core X-radiographs or core computer tomography scans.
- Record the fracture distribution with depth (Figure 2). (Recording of this and all following data could be done in a tabular format compatible with computer entry to facilitate output compatible with other strip and well logs.)
- Relate fracture distribution to rock type.
- Record the dip of fractures either real or apparent.
- Back up core observations with appropriate logs from the same zones as core from the well for effective extrapolation to uncored wells (see Formation evaluation of naturally fractured reservoirs). Record the strike of features if the core is oriented core or if it is locally oriented either mechanically or by oriented logs such as the Borehole Televiewer, Formation MicroScanner, or high-resolution dipmeter.[8] (For more on these methods, see Core orientation, Borehole imaging devices, and Dipmeter.)
- Look for intersection angles of fractures as expressed on the outside surface of the core or on the ends of the samples and record the true or apparent angles (Figure 2).
- Determine which of the fractures in the core are natural or induced.[9]
- Describe stylolite distribution (position, rock type, and postulated σ1.[1][6]
- Determine fracture plane morphology, paying particular attention to any partial mineralization along the fracture planes that might act as a natural proppant during depletion.[1] If present, determine its mineralogy and predicted relative compressive strength.
- Measure the relative size or height of the fractures, paying particular attention to any rock features that tend to control the vertical extent of the fractures, such as lithology breaks, bedding planes, stylolites, or unconformities.
- Observe the width and width variation of the fractures. Measurements of width could be made with a scale, micrometer, or caliper or by impregnation with epoxy or plastic for either thin section measurement of epoxy width or dissolution of matrix leaving the width at the depth approximated.[1]
- Estimate or measure fracture spacing and its variability with depth.[10][11]
- Determine principal stress directions and the origin and continuity of the fracture system(s).[5][1]
- Determine the relative timing of deformational events from cross-cutting relationships or paragenetic sequence.[12]
- Relate fracture distribution to rock properties and rock fabric (such as composition, porosity, preferred grain orientation, bedding, and cross-bedding). Structural and petrological descriptions go hand in hand.[1]
- Select samples for additional petrophysical or petrological determinations (such as X-ray, thin sections, and permeability) (see Thin section analysis and SEM, XRD, CL, and XF methods).
- Estimate the permeability of properly oriented individual fractures from core analyses (see Permeability).
- Qualitatively estimate fracture and matrix porosity interaction or at least determine if there is any evidence of impedance to cross-flow[1]) (see Porosity).
- Determine the fractured reservoir type.[1]
- Photograph important relationships shown in the core for documentation in reports, if needed.
- Select samples for mechanical testing, if appropriate.
- If needed, set up a checklist of important parameters and document as many parameters as needed on a foot-by-foot basis (on each whole core piece is ideal). Such a checklist should be compatible with direct computer input of the tabular data (see Figure 2).
- Write down impressions and conclusions arrived at before leaving the core. Include thoughts on the relative importance of fractures to production and flow, the permeability of the fractures present, fracture porosity (qualitative), fracture fill and relative compressibility of the fractures, fracture origin and continuity in the reservoir, the percentage of real versus induced fractures, and the fractured reservoir type.
Outcrop analysis
When collecting fracture data from outcrops, one should look for rocks similar to the reservoir rocks of interest on similar outcropping structures. Look at more of the rock section than just the prospective reservoir rock, including potential sealing beds, and pay attention to relative fracture intensity between layered units.
- Select outcrop areas having representative fracture patterns for specific structural positions. Record strike and dip data, or at least strike data. Additional sites can be chosen for one unit at different positions within the structure.
- For a so-called quantitative measurement station (having enough fracture measurements to be statistically meaningful), all fractures in the measurement area should be recorded and should number from about 100 to 150 fractures. The actual number should depend on the complexity of the fracture patterns present.
- For a so-called qualitative measurement station (not having enough fracture measurements to be statistically meaningful), only general fracture trends are recorded, along with a judgment of relative abundance of the individual fracture orientations. These are often used when spot checking areas between statistical measurement stations. If no major change in orientation and intensity of fracture patterns is observed away from nearby statistical measurements stations, the use of qualitative stations gives valid intermediate data.
- At the individual measurement stations, the analyst should record as much of the following information as possible.[1]
- Each individual fracture measurement at the station should record as much of the following data as possible (see [1]).
- At convenient times, the fracture data should be plotted in preliminary form on either rose diagrams or pole plots (π diagrams). Such preliminary plotting is necessary in the field to establish trends and application to simple geological fracture models. In this way, working interpretive models can be created and altered or updated while field data are still being gathered. The observer should always examine fracture patterns in light of their relationship to their localities and to local structural configuration.
- The number and frequency or spacing of quantitative measurement stations are generally high in the early stages of study in a region and decrease in relationship to qualitative stations throughout the study.
- When dealing with outcrops containing a predominance of either contractional fractures or fractures related to unconformity surfaces,[1] much of the previous quantitative orientation data will be ill-defined due to their isotropic or irregular distribution in orientation. In these outcrops, matrix block size (fracture spacing in three dimensions) are very important, as are lateral distribution and lithology.
- Photograph all outcrops measured and take block samples (about 10” × 6” × 5”) of all major units of interest for petrophysical and possibly mechanical testing.
Crossplots
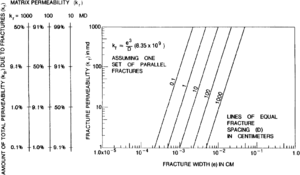
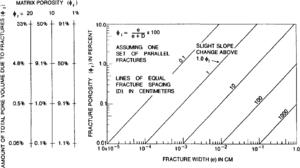
In doing core and outcrop analyses of fractures to determine reservoir properties and reservoir type, it is often difficult to judge the relative effect of the fracture system. Two crossplots can be used to alleviate this problem (Figures 3 and 4). These plots are the percentage of total reservoir permeability (Figure 3) and porosity (Figure 4) as a function of fracture width and fracture spacing for various orders of magnitude of matrix values. Assumptions can be made for width of the fractures at depth. Matrix properties are determined from core analyses, thin sections, etc. and the relative contribution of the fracture system for various spacings can then be read off the graph. Ideally, ranges in values for width and spacing of fractures are used and a box or area created on the graph within which the actual value is likely to occur. These figures assume one set of regularly spaced fractures, hydraulic apertures, and parallel plate laminar flow.[1]
Checklist for sequence of study
The following checklist will aid in outlining the work flow of a fractured reservoir evaluation:
- Document fracture presence
- Determine if structure is present
- Seismic, gravity, magnetics
- Structure maps
- Dipmeters[8]
- Determine lithological control of fracture distribution
- Document fracture systems geometry
- Document fracture morphology
- Determine fracture type (origin)
- Predict fracture distribution and extent
- Extrapolation using fracture type and observations
- Estimate fracture spacing and spacing variability
- Estimate fracture width
- Laboratory data
- Flow test data
- Thin sections
- Impregnation and dissolution
- Estimate reservoir properties at depth
- Estimate fracture and matrix interaction
- φf / φm interaction
- kf / km contrast
- Correlate small-scale petrophysical properties with large-scale reservoir engineering tests[13][6]
- Determine fractured reservoir type
- Correlate matrix and fracture properties and their communication to determine relative contribution of the fracture system and potential recovery problem[1]
- Make conclusions relevant to the type of evaluation
- Early exploration evaluation
- Estimation of economic potential
- Recovery planning and reservoir modeling
See also
- Lithofacies and environmental analysis of clastic depositional systems
- Flow units for reservoir characterization
- Evaluating structurally complex reservoirs
- Evaluating tight gas reservoirs
- Reservoir quality
- Carbonate reservoir models: facies, diagenesis, and flow characterization
- Fluid contacts
- Geological heterogeneities
- Evaluating stratigraphically complex fields
- Evaluating diagenetically complex reservoirs
References
- ↑ 1.00 1.01 1.02 1.03 1.04 1.05 1.06 1.07 1.08 1.09 1.10 1.11 1.12 1.13 1.14 1.15 1.16 1.17 1.18 1.19 1.20 1.21 1.22 1.23 1.24 1.25 Nelson, R. A., 1985, Geologic analysis of naturally fractured reservoirs—Contributions in Petroleum Geology and Engineering #1: Houston, TX, Gulf Publishing Company, 320 p.
- ↑ Moslow, T. F., Tillman, R. W., 1986, Sedimentary facies and reservoir characteristics of Frontier Formation sandstones, southwestern Wyoming, in Spencer, C. W., Mast, R. F., eds., Geology of Tight Gas Reservoirs: AAPG Studies in Geology Series 24, p. 271–295.
- ↑ 3.0 3.1 Pitman, J. K., Sprunt, E. S., 1986, Origin and distribution of fractures in Lower Tertiary and Upper Cretaceous rocks, Piceance basin, Colorado, and their relation to the occurrence of hydrocarbons in Spencer, C. W., Mast, R. F., eds., Geology of Tight Gas Reservoirs: AAPG Studies in Geology Series 24, p. 221–234.
- ↑ Rose, P. R., Everett, J. R., Merin, I. A., 1986, Potential basin-centered gas accumulation in Cretaceous Trinidad Sandstone, Raton Basin, Colorado in Spencer, C. W., Mast, R. F., eds., Geology of Tight Gas Reservoirs: AAPG Studies in Geology Series 24, p. 111–128.
- ↑ 5.0 5.1 5.2 5.3 Stearns, D. W., Friedman, M. 1972, Reservoirs in fractured rock in Stearns, D. W., and Friendman, N., Stratigraphic Oil and Gas Fields--Classification, Exploration Methods and Case Histories: AAPG Memoir 16, p. 82–100.
- ↑ 6.0 6.1 6.2 6.3 6.4 6.5 van Golf-Racht, T. D., 1982, Fundamentals of fractured reservoir engineering—Developments in Petroleum Science No. 12: Amsterdam, Elsevier Scientific Publishing Co., 710 p.
- ↑ Reiss, L. H., 1980, The reservoir engineering aspects of fractured formations: Houston, TX, Gulf Publishing Company, 108 p.
- ↑ 8.0 8.1 8.2 8.3 Plumb, R. A., Luthi, S. M., 1986, Application of borehole images to geologic modeling of an eolian reservoir: 61st Annual Technical Conference of the Society of Petroleum Engineers, New Orleans, LA, Oct. 5–8, SPE 15487, 11. p.
- ↑ Kulander, B. R., Dean, S. L., 1985, Hackle plume geometry and joint propagation dynamics, in Stephansson, O. ed., Fundamentals of Rock Joints: Proceedings of the International Symposium, Bjorkliden, Sept. 15–20, p. 85–94.
- ↑ 10.0 10.1 Narr, W., Lerche, I. 1984, A method for estimating subsurface fracture density in core: AAPG Bulletin, v. 68, p. 637–648.
- ↑ Nolen-Hoeksema, R. C., Howard, J. H., 1987, Estimating drilling direction for optimum production in a fractured reservoir: AAPG Bulletin, v. 71, p. 958–966.
- ↑ Lindquist, S. J., 1983, Nugget Formation reservoir characteristics affecting production the Overthrust Belt of southwestern Wyoming: Journal of Petroleum Technology, July, p. 1355–1365.
- ↑ 13.0 13.1 13.2 13.3 13.4 Aguilera, R. 1980, Naturally fractured reservoirs: Tulsa, OK, PennWell Books, 703 p.
- ↑ La Pointe, P. R., and J. A. Hudson, 1985, Characterization and interpretation of rock mass joint patterns: Geological Society of America Special Paper 199, 37 p.
