Difference between revisions of "Subsurface maps"
FWhitehurst (talk | contribs) |
Cwhitehurst (talk | contribs) m (added Category:Methods in Exploration 10 using HotCat) |
||
| (38 intermediate revisions by 3 users not shown) | |||
| Line 19: | Line 19: | ||
A number of surfaces are typically mapped during [[Field development|reservoir development]] to show closure and other limits to reservoir production. Maps of top of pay and bottom of pay can also be “subtracted” to determine pay thickness. | A number of surfaces are typically mapped during [[Field development|reservoir development]] to show closure and other limits to reservoir production. Maps of top of pay and bottom of pay can also be “subtracted” to determine pay thickness. | ||
| − | [[file:subsurface-maps_fig1.png| | + | [[file:subsurface-maps_fig1.png|300px|thumb|{{figure number|1}}Structure map of the top of the T5 marker, Frlo Formation, Brazoria County, Texas. (After Bebout el al.)<ref name=pt06r12>Bebout, D. G., Loucks, R. G., Gregory, A. R., 1978, Frio Sandstone reservoirs in the deep subsurface along the Texas Gulf coast—their potential for production of geopressured geothermal energy: The Univ. of Texas Bureau of Economic Geology Report of Investigations, n. 91, 93 p.</ref>]] |
===Structure=== | ===Structure=== | ||
| Line 25: | Line 25: | ||
Structure maps show [[Contours|lines of equal elevation or depth]] for a selected [[Markers|marker horizon]] ([[:file:subsurface-maps_fig1.png|Figure 1]]) (see [[Evaluating structurally complex reservoirs]]). Mean sea level is a useful reference datum. Commonly contoured horizons are top of zone or top of net pay. Control points are provided by surveyed wells and can be supplemented by [[seismic interpretation]]s, especially offshore. In highly developed fields, typically onshore, sufficient well control might exist to allow [[geostatistical interpolation]] between control points. | Structure maps show [[Contours|lines of equal elevation or depth]] for a selected [[Markers|marker horizon]] ([[:file:subsurface-maps_fig1.png|Figure 1]]) (see [[Evaluating structurally complex reservoirs]]). Mean sea level is a useful reference datum. Commonly contoured horizons are top of zone or top of net pay. Control points are provided by surveyed wells and can be supplemented by [[seismic interpretation]]s, especially offshore. In highly developed fields, typically onshore, sufficient well control might exist to allow [[geostatistical interpolation]] between control points. | ||
| − | [[file:subsurface-maps_fig2.png|thumb|{{figure number|2}}Structure of the base of the Humber unconformity (top of the Brent Group), Dunlin field, U.K. Northern North Sea mapped with 1979 and 1989 vintage data. Contours are marked in ft subsea × 100; contour interval is 100 ft. (From <ref name=pt06r16>Braithwaite, C. I. M., Marshall, J. D., Holland, T. C., 1989, Improving recovery from the Dunlin field, U., K. Northern North Sea, in Formation Evaluation and Reservoir Geology: 64th Annual Technical Conference of the Society of Petroleum Engineers, San Antonio, TX, Oct. 8–11, SPE 19878, 18 p.</ref> | + | [[file:subsurface-maps_fig2.png|300px|thumb|{{figure number|2}}Structure of the base of the Humber unconformity (top of the Brent Group), Dunlin field, U.K. Northern North Sea mapped with 1979 and 1989 vintage data. Contours are marked in ft subsea × 100; contour interval is 100 ft. (From Braithwaite et al.)<ref name=pt06r16>Braithwaite, C. I. M., Marshall, J. D., Holland, T. C., 1989, [https://www.onepetro.org/conference-paper/SPE-19878-MS Improving recovery from the Dunlin field, U., K. Northern North Sea, in Formation Evaluation and Reservoir Geology]: 64th Annual Technical Conference of the Society of Petroleum Engineers, San Antonio, TX, Oct. 8–11, SPE 19878, 18 p.</ref>]] |
===Fault planes=== | ===Fault planes=== | ||
| − | [[ | + | [[Fault]]s are special surfaces whose traces will show on structure contour maps ([[:file:subsurface-maps_fig1.png|Figures 1]] and [[:file:subsurface-maps_fig2.png|2]]). Faults form bounding surfaces for some reservoirs, and sufficient well control might exist to contour map the fault surface itself. Projections of subsurface data into the plane of the fault are also useful “maps” for reservoir development, but are more appropriately described as [[cross section]]s. (For details of construction of fault plane maps, see [[Conversion of well log data to subsurface stratigraphic and structural information]].) |
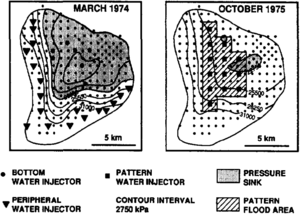
| − | [[file:subsurface-maps_fig3.png|thumb| | + | [[file:subsurface-maps_fig3.png|thumb|300px|{{figure number|3}}Map of pressure response to pattern flood, Judy Creek field, western Canada, 1974 and 1975. Contour interval is 2750 kPa. (After Jardine et al.)<ref name=pt06r58>Jardine, D., Wilshart, J. W., 1987, Carbonate reservoir description, in Tillman, R. W., Weber, K. J., eds. Reservoir Sedimentology: SEPM Special Publication 40, p. 129–152.</ref>]] |
===Unconformities and subcrops=== | ===Unconformities and subcrops=== | ||
| − | [[Mapping unconformities|Surfaces of unconformity]] can be especially useful [[ | + | [[Mapping unconformities|Surfaces of unconformity]] can be especially useful [[Marker|marker horizons]] for structure contour mapping ([[:file:subsurface-maps_fig2.png|Figure 2]]). In many fields, [[Unconformity|unconformities]] are the location of sealing [[shale]]s and/or source rocks above reservoir pay. [[Subcrop map]]s, traces of productive zones, barriers, or marker horizons mapped on the unconformity surface are invaluable for planning well placement and for [[Field development|reservoir development]]. |
===Pressure=== | ===Pressure=== | ||
| Line 43: | Line 43: | ||
==Mapping thicknesses== | ==Mapping thicknesses== | ||
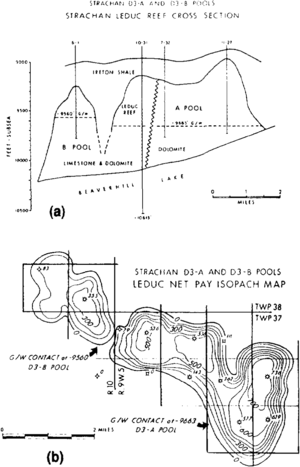
| − | [[file:subsurface-maps_fig4.png|thumb|{{figure number|4}}(a) Cross section and (b) net pay Isopach map of the Strachan gas field, western Canada. Contour Interval is 100 ft. (From <ref name=pt06r55>Hriskevich, M. E., Faber, J. M., Langton, J. R., 1980, [http://archives.datapages.com/data/specpubs/fieldst2/data/a012/a012/0001/0300/0315.htm Strachan and Ricinus West gas fields], Alberta, Canada, in Halbouty, M. T., ed., Giant Oil and Gas Fields of the Decade 1968–1978: AAPG Memoir 30, p. 315–327.</ref> | + | [[file:subsurface-maps_fig4.png|300px|thumb|{{figure number|4}}(a) Cross section and (b) net pay Isopach map of the Strachan gas field, western Canada. Contour Interval is 100 ft. (From Hriskevich et al.)<ref name=pt06r55>Hriskevich, M. E., Faber, J. M., Langton, J. R., 1980, [http://archives.datapages.com/data/specpubs/fieldst2/data/a012/a012/0001/0300/0315.htm Strachan and Ricinus West gas fields], Alberta, Canada, in Halbouty, M. T., ed., Giant Oil and Gas Fields of the Decade 1968–1978: AAPG Memoir 30, p. 315–327.</ref>]] |
Interpretations of [[Depositional environments|depositional trends]], [[Predepositional structure|pre-]] and [[Syndepositional structure|syndepositional]] structural development, and reservoir [[storage capacity]] are based in large part on thickness information. An accurate meaning of thickness is critical in these and other analyses (see [[Conversion of well log data to subsurface stratigraphic and structural information]]). | Interpretations of [[Depositional environments|depositional trends]], [[Predepositional structure|pre-]] and [[Syndepositional structure|syndepositional]] structural development, and reservoir [[storage capacity]] are based in large part on thickness information. An accurate meaning of thickness is critical in these and other analyses (see [[Conversion of well log data to subsurface stratigraphic and structural information]]). | ||
| Line 49: | Line 49: | ||
===Isopach=== | ===Isopach=== | ||
| − | A contour map of equal values of true stratigraphic thickness is an ''isopach map'' ([[:file:subsurface-maps_fig4.png|Figure 4]]). Except for vertical wells in horizontal beds, corrections for [[Wellbore trajectory|wellbore deviation]] and formation [[dip]] are needed to make isopach maps. | + | A [[contour]] map of equal values of true stratigraphic thickness is an ''isopach map'' ([[:file:subsurface-maps_fig4.png|Figure 4]]). Except for vertical wells in horizontal beds, corrections for [[Wellbore trajectory|wellbore deviation]] and formation [[dip]] are needed to make isopach maps. |
===Isochore=== | ===Isochore=== | ||
| − | A contour map of equal values of true vertical thickness is an ''isochore map.''<ref name=pt06r141>Tucker, P. M., 1988, Seismic contouring—a unique skill: Geophysics, v. 53, n. 6, p. 741–749, DOI: 10.1190/1.1442509.</ref> Note that in common practice, isochore maps are informally referred to as “isopach” maps, a term that properly should be restricted to true stratigraphic thickness. | + | A contour map of equal values of true vertical thickness is an ''isochore map.''<ref name=pt06r141>Tucker, P. M., 1988, Seismic contouring—a unique skill: Geophysics, v. 53, n. 6, p. 741–749, DOI: [http://library.seg.org/doi/abs/10.1190/1.1442509%20 10.1190/1.1442509].</ref> Note that in common practice, isochore maps are informally referred to as “isopach” maps, a term that properly should be restricted to true stratigraphic thickness. |
===Isochron=== | ===Isochron=== | ||
| − | An ''[[Mapping with two-dimensional seismic data#Time interval maps|isochron map]]'' is a contour map of equal values of seismic traveltime between selected events.<ref name=pt06r141 /> Isochron maps are the seismic analog of isochore maps and, as such, are intended to derive thickness information from seismic data. Isochroning between events above and below a pay horizon, for example, would estimate pay thickness. Renick and Gunn<ref name=pt06r109>Renick, H. Jr., Gunn, R. D., 1989, Triangle Ranch Headquarters field development using shallow core holes and high-resolution seismic data: Geophysics, v. 54, n. 11, p. 1384–1396, DOI: 10.1190/1.1442602</ref> present a good case history of using isochron and time-structure maps to generate “isopach” and elevation-structure maps. Their isochron-isopach approach delineated reef trends for further development drilling and used well penetrations through a shallow horizon for depth control on a deeper horizon. Phipps<ref name=pt06r99>Phipps, G. G., 1989, Exploring for dolomitized Slave Point carbonates in northeastern British Columbia: Geophysics, v. 54, n. 7, p. 806–814, DOI: 10.1190/1.1442709</ref> documents the pros and cons of using isochron thins and structural highs as exploration drilling criteria for dolomitized Devonian limestones. | + | An ''[[Mapping with two-dimensional seismic data#Time interval maps|isochron map]]'' is a contour map of equal values of seismic traveltime between selected events.<ref name=pt06r141 /> [[Isochron]] maps are the seismic analog of isochore maps and, as such, are intended to derive thickness information from seismic data. Isochroning between events above and below a pay horizon, for example, would estimate pay thickness. Renick and Gunn<ref name=pt06r109>Renick, H. Jr., Gunn, R. D., 1989, Triangle Ranch Headquarters field development using shallow core holes and high-resolution seismic data: Geophysics, v. 54, n. 11, p. 1384–1396, DOI: [http://library.seg.org/doi/abs/10.1190/1.1442602 10.1190/1.1442602].</ref> present a good case history of using isochron and time-structure maps to generate “isopach” and elevation-structure maps. Their isochron-isopach approach delineated reef trends for further development drilling and used well penetrations through a shallow horizon for depth control on a deeper horizon. Phipps<ref name=pt06r99>Phipps, G. G., 1989, Exploring for dolomitized Slave Point carbonates in northeastern British Columbia: Geophysics, v. 54, n. 7, p. 806–814, DOI: [http://library.seg.org/doi/abs/10.1190/1.1442709 10.1190/1.1442709].</ref> documents the pros and cons of using isochron thins and structural highs as exploration drilling criteria for dolomitized Devonian limestones. |
==Mapping to calculate reserves== | ==Mapping to calculate reserves== | ||
| Line 81: | Line 81: | ||
The product ''A'' × ''H'' is the reservoir bulk volume, and the product ''A'' × ''H'' × ϕ is the reservoir pore volume. The general determination of bulk reservoir volume involves mapping reservoir area in plan view and mapping net pay in terms of true vertical thickness to provide a common presentation of dipping beds or deviated wells. An [[Subsurface maps#Isochore|isochore]] map of net pay should be contoured using well control points and interpolated or extrapolated using available seismic and well test data and the geologist's interpretation of [[Depositional environments|depositional]] and [[Diagenesis|diagenetic]] history. | The product ''A'' × ''H'' is the reservoir bulk volume, and the product ''A'' × ''H'' × ϕ is the reservoir pore volume. The general determination of bulk reservoir volume involves mapping reservoir area in plan view and mapping net pay in terms of true vertical thickness to provide a common presentation of dipping beds or deviated wells. An [[Subsurface maps#Isochore|isochore]] map of net pay should be contoured using well control points and interpolated or extrapolated using available seismic and well test data and the geologist's interpretation of [[Depositional environments|depositional]] and [[Diagenesis|diagenetic]] history. | ||
| − | “Net” pay (see [[Effective pay determination]]) implies that some formation thickness has been excluded from consideration by either (1) occurring below an [ | + | “Net” pay (see [[Effective pay determination]]) implies that some formation thickness has been excluded from consideration by either (1) occurring below an [http://www.glossary.oilfield.slb.com/en/Terms.aspx?LookIn=term%20name&filter=oil-water+contact oil-water contact] (or above a [http://www.glossary.oilfield.slb.com/en/Terms.aspx?LookIn=term%20name&filter=gas-water+contact gas-water contact]), or (2) having porosity and/or [[permeability]] values below a “cutoff” limit for productivity. Not all net pay is necessarily productive at a given well spacing. Discontinuous productive horizons between wells might be described, for example, by the concept of net pay to net connected pay ratio.<ref name=pt06r103>Poston, S. W., 1987, [https://www.onepetro.org/book/peh/spe-1987-36-peh Development plan for oil and gas reservoirs], in Bradley, H. B., ed., Petroleum Engineering Handbook: Richardson, TX, Society of Petroleum Engineers, p. 36-1–36-11.</ref> |
| − | + | ===Porosity=== | |
| − | + | [[file:subsurface-maps_fig5.png|thumb|300px|{{figure number|5}}Porosity-weighted average water saturation map for Layer 2 of a Middle Eastern carbonate reservoir.]] | |
| − | The porosity (ϕ) in a reservoir zone can be determined from log and/or core data. The data in an individual well within the net pay interval can be averaged arithmetically and posted on a map for contouring. The averages should be weighted by thickness. | + | The [[porosity]] (ϕ) in a reservoir zone can be determined from log and/or core data. The data in an individual well within the net pay interval can be averaged arithmetically and posted on a map for contouring. The averages should be weighted by thickness. |
===Water saturation=== | ===Water saturation=== | ||
| − | The water saturation (S<sub>w</sub>) within the net pay interval is typically estimated from well logs. Water saturations can also be derived from [[capillary pressure]] testing of cores to determine the relationship of water saturation versus height above the oil-water contact | + | The [[water saturation]] (S<sub>w</sub>) within the net pay interval is typically estimated from well logs. Water saturations can also be derived from [[capillary pressure]] testing of cores to determine the relationship of water saturation versus height above the [http://www.glossary.oilfield.slb.com/en/Terms.aspx?LookIn=term%20name&filter=oil-water%20contact oil-water contact]. Like porosity, the water saturation data in an individual well within the net pay interval can be averaged arithmetically and posted on a map for contouring ([[:file:subsurface-maps_fig5.png|Figure 5]]). The averages should be weighted by porosity. |
===Oil saturation=== | ===Oil saturation=== | ||
| − | In an oil-water system, the water saturation and oil saturation (S<sub>o</sub>) sum to 1. Therefore, once S<sub>w</sub> has been determined, oil saturation can be calculated and mapped as ''S''<sub>o</sub> = 1–''S''<sub>w</sub>. | + | In an oil-water system, the [[water saturation]] and oil saturation (S<sub>o</sub>) sum to 1. Therefore, once S<sub>w</sub> has been determined, oil saturation can be calculated and mapped as ''S''<sub>o</sub> = 1–''S''<sub>w</sub>. |
==Mapping for reservoir management== | ==Mapping for reservoir management== | ||
| Line 101: | Line 101: | ||
A variety of maps are used to predict or monitor reservoir performance. | A variety of maps are used to predict or monitor reservoir performance. | ||
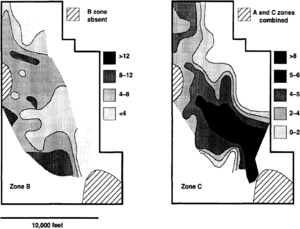
| − | [[file:subsurface-maps_fig6.png|thumb|{{figure number|6}}Porosity thickness (ϕH) maps for the B and C zones from the San Andres Formation reservoir, Jordan field, Ector and Crane Counties, Texas. Contours in PV fraction-feet. (After <ref name=pt06r81>Major, R. P., Holtz, M. H., 1989, | + | [[file:subsurface-maps_fig6.png|300px|thumb|{{figure number|6}}Porosity thickness (ϕH) maps for the B and C zones from the San Andres Formation reservoir, Jordan field, Ector and Crane Counties, Texas. Contours in PV fraction-feet. (After Major et al.)<ref name=pt06r81>Major, R. P., Holtz, M. H., 1989, [https://www.onepetro.org/journal-paper/SPE-19874-PA Depositionally and Diagenetically Controlled Reservoir Heterogeneity at Jordan Field]: 64th Annual Technology Conference of the Society of Petroleum Engineers, San Antonio, TX, Oct., SPE 19874, p. 633–640.</ref>]] |
| − | === | + | ===Permeability=== |
| − | Permeability (''k'') can also be mapped and contoured (see | + | [[Permeability]] (''k'') can also be mapped and contoured (see [[Core-log transformations and porosity-permeability relationships]]). As for [[Water saturation|saturation]] values, some care must be exercised in mapping permeability because values must be derived from indirect measurements. Typically, permeabilities are derived from wireline log [[Porosity|porosities]] transformed on the basis of core permeability versus porosity cross plots. Permeabilities can be reported at ambient laboratory conditions of pressure or adjusted to reservoir conditions of [[confining pressure]]. Similarly, permeabilities can be absolute permeabilities to air (nitrogen) or liquid or effective permeabilities]] to oil in the presence of [http://petrowiki.org/Glossary%3AIrreducible_water_saturation irreducible water]. Permeability values in an individual well are thickness weighted and typically [[Averaging|averaged harmonically, arithmetically, or geometrically]], depending on [[flow geometry]]. Alternatively, [[flow capacity]] (''kH'') values derived from [[pressure transient testing]] can be divided by net pay thickness (''H'') to yield a liquid permeability value for a well. |
===Porosity thickness=== | ===Porosity thickness=== | ||
| Line 113: | Line 113: | ||
===Productivity index=== | ===Productivity index=== | ||
| − | To avoid coning, sand production, pipe collapse, or other harmful effects, wells might not be produced at their maximum wide-open flow rates. Therefore, the ability of a well to produce is usually determined by a productivity index (PI).<ref name=pt06r66>Kimmel, J. D., Dalati, R. N., 1987, Potential tests of oil wells, in Bradley, H. B., ed., Petroleum Engineering Handbook: Richardson, TX, Society of Petroleum Engineers, p. 32-1–32-16.</ref> The PI is a measure of the stock tank barrels (STB) of oil produced per day per psi drawdown under steady | + | To avoid [[Production problems#Water-gas coning|coning]], sand production, pipe collapse, or other harmful effects, wells might not be produced at their [[Absolute open flow|maximum wide-open flow]] rates. Therefore, the ability of a well to produce is usually determined by a [[Production testing#Single-point tests|productivity index]] (PI).<ref name=pt06r66>Kimmel, J. D., Dalati, R. N., 1987, [https://www.onepetro.org/book/peh/spe-1987-32-peh Potential tests of oil wells], in Bradley, H. B., ed., Petroleum Engineering Handbook: Richardson, TX, Society of Petroleum Engineers, p. 32-1–32-16.</ref> The PI is a measure of the stock tank barrels (STB) of oil produced per day per psi drawdown under [[Steady state conditions|steady state]] or [[Pseudosteady state conditions|pseudosteady state flow conditions]]. Changes will show on periodic maps of PI during reservoir life indicating trends in reservoir depletion or formation damage. |
===Solution gas to oil ratio=== | ===Solution gas to oil ratio=== | ||
| − | Engineers forecast ultimate recoverable reserves by applying material balance equations or decline curve analysis to production history records. For example, in a depletion-type reservoir, the solution gas to oil ratio is sometimes plotted versus cumulative oil production on semilog paper.<ref name=pt06r37>Garb, F. A., Smith, G. L., 1987, Estimation of oil and gas reserves, in Bradley, H. B., ed., Petroleum Engineering Handbook: Richardson, TX, Society of Petroleum Engineers, p. 4-1–40-38.</ref> If such a curve shows a good straight-line relationship, the curve can be used to predict the trend of a cumulative gas or cumulative oil plot to estimate ultimate recovery. | + | Engineers forecast [[Reserves estimation|ultimate recoverable reserves]] by applying material balance equations or [[Production histories#Decline curve analysis|decline curve analysis]] to production history records. For example, in a [[Drive mechanisms and recovery#Solution gas drive|depletion]]-type reservoir, the solution gas to oil ratio is sometimes plotted versus cumulative oil production on semilog paper.<ref name=pt06r37>Garb, F. A., Smith, G. L., 1987, [https://www.onepetro.org/book/peh/spe-1987-40-peh Estimation of oil and gas reserves], in Bradley, H. B., ed., Petroleum Engineering Handbook: Richardson, TX, Society of Petroleum Engineers, p. 4-1–40-38.</ref> If such a curve shows a good straight-line relationship, the curve can be used to predict the trend of a cumulative gas or cumulative oil plot to estimate ultimate recovery. |
The solution gas to oil ratio (GOR) is the amount of dissolved gas that will evolve from the oil as the pressure is reduced to atmospheric from some higher pressure. GOR is usually expressed in units of SCF gas/STB oil. A barrel of oil and its solution gas at reservoir conditions of temperature and pressure will usually “shrink” as the fluid is produced and brought to stock tank conditions (normally reported at [[temperature::60°F]] and 14.7 psia). As GOR changes during reservoir life, GORs for individual wells can be mapped periodically to identify areas of the reservoir receiving or not receiving pressure support and serving as indicators for reservoir management action. | The solution gas to oil ratio (GOR) is the amount of dissolved gas that will evolve from the oil as the pressure is reduced to atmospheric from some higher pressure. GOR is usually expressed in units of SCF gas/STB oil. A barrel of oil and its solution gas at reservoir conditions of temperature and pressure will usually “shrink” as the fluid is produced and brought to stock tank conditions (normally reported at [[temperature::60°F]] and 14.7 psia). As GOR changes during reservoir life, GORs for individual wells can be mapped periodically to identify areas of the reservoir receiving or not receiving pressure support and serving as indicators for reservoir management action. | ||
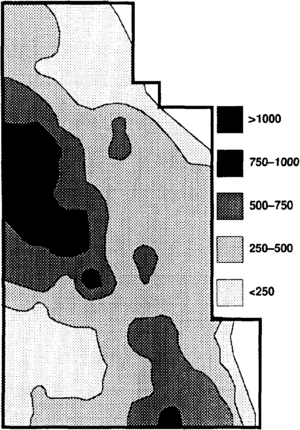
| − | [[file:subsurface-maps_fig7.png|thumb| | + | [[file:subsurface-maps_fig7.png|thumb|300px|{{figure number|7}}Cumulative oil production map for the A, B, C, and D zones from the San Andres Formation reservoir, Jordan field, Ector and Crane counties, Texas. Contours in MSTB/year/acre. (After Major et al.)<ref name=pt06r81 />]] |
===Water cut=== | ===Water cut=== | ||
| − | Water cut is the fraction of a liquid production stream that is water, where oil cut = 1 - water cut. Like GOR, water cut will change during the life of a reservoir, and periodic mapping can serve as a performance indicator for reservoir management. A variety of performance features can be indicated by water cut maps, including water coning, directional permeability or channeling, and formation damage. | + | Water cut is the fraction of a liquid production stream that is water, where oil cut = 1 - water cut. Like GOR, water cut will change during the life of a reservoir, and periodic mapping can serve as a performance indicator for reservoir management. A variety of performance features can be indicated by water cut maps, including [[Production problems#Water-gas coning|water coning]], [[directional permeability]] or channeling, and [[Rock-water reaction: formation damage|formation damage]]. |
===Cumulative production=== | ===Cumulative production=== | ||
| − | Cumulative oil or gas production is a parameter useful for ultimate reserves forecasts. Cumulative production can also be mapped periodically as a performance indicator signaling areas of the reservoir that may be responding in a manner seemingly unrelated to initial potential. [[:file:subsurface-maps_fig7.png|Figure 7]] shows an example of cumulative production that was concluded to be only poorly correlated to storage capacity (Figure 6) in individual and summed zones of a carbonate reservoir.<ref name=pt06r81 /> In this case, porosity did not necessarily indicate effective porosity. | + | Cumulative oil or gas production is a parameter useful for ultimate [[Reserves estimation|reserves forecasts]]. Cumulative production can also be mapped periodically as a performance indicator signaling areas of the reservoir that may be responding in a manner seemingly unrelated to initial potential. [[:file:subsurface-maps_fig7.png|Figure 7]] shows an example of cumulative production that was concluded to be only poorly correlated to storage capacity (Figure 6) in individual and summed zones of a carbonate reservoir.<ref name=pt06r81 /> In this case, porosity did not necessarily indicate effective porosity. |
==Other maps== | ==Other maps== | ||
| − | A variety of other maps can come into play during the development of a specific reservoir. Maps of facies, facies architecture, paleoenvironment, and isolithology might be particularly important in selecting stepout well | + | A variety of other maps can come into play during the development of a specific reservoir. Maps of facies, facies architecture for more information, see [[Lithofacies and environmental analysis of clastic depositional systems]] and [[Carbonate reservoir models: facies, diagenesis, and flow characterization]]), paleoenvironment, and isolithology might be particularly important in selecting [[stepout well location]]s and planning reservoir development strategy. Other reservoir properties such as [[Wikipedia:Temperature|temperature]] can have value for specific reservoir engineering applications, particularly where potentially temperature-sensitive chemical [[stimulation]], production, or recovery technology might be involved. |
| + | |||
| + | ==Examples of use== | ||
| + | |||
| + | * Bally, A. W., Gordy, P. L., Stewart, G. A., 1966, Structure, seismic data and orogenic evolution of southern Canadian Rocky Mountains: Bulletin of Canadian Petroleum Geology, vol. 4, p. 337–381. | ||
| + | * Bally, A. W., Burbi, L., Cooper, C., Ghelardoni, R., 1986, Balanced sections and seismic reflection profiles across the central Apennines: Memorie della Societa Geologica Italiana, vol. 35, p. 257–310. | ||
| + | * Dixon, J. S., 1982, [http://archives.datapages.com/data/bulletns/1982-83/data/pg/0066/0010/1550/1560.htm Regional structural synthesis, Wyoming salient of the Western over-thrust belt]: AAPG Bulletin, vol. 66, p. 1560–1580. | ||
| + | * Dunn, J. F., Hartshorn, K. G., Hartshorn, P. W., 1995, [http://archives.datapages.com/data/specpubs/memoir62/27dunn/0523.htm Structural styles and hydrocarbon potential of the Sub-Andean thrust belt of southern Bolivia], in Tankard, A. J., Suarez, R. S., Welsink, H. J., eds., Petroleum Basins of South America: [http://store.aapg.org/detail.aspx?id=476 AAPG Memoir 62], p. 523–543. | ||
| + | * Dutton, S. P., Goldstein, A. G., Ruppel, S. C., 1982, Petroleum potential of the Palo Duro basin, Texas Panhandle: University of Texas at Austin Bureau of Economic Geology Report of Investigations 123, 87 p. | ||
| + | * Picha, F. J., 1996, [http://archives.datapages.com/data/bulletns/1994-96/data/pg/0080/0010/1500/1547.htm Exploring for hydrocarbons under thrust belts—a challenging new frontier in the Carpathians and elsewhere]: AAPG Bulletin, vol. 80, p. 1547–1564. | ||
| + | * Roure, F., Carnevali, J. O., Gou, Y., Subieta, T., 1994, Geometry and kinematics of the north Monagas thrust belt (Venezuela): Marine and Petroleum Geology, vol. 11, p. 347–362., 10., 1016/0264-8172(94)90054-X | ||
==See also== | ==See also== | ||
* [[Introduction to geological methods]] | * [[Introduction to geological methods]] | ||
* [[Lithofacies and environmental analysis of clastic depositional systems]] | * [[Lithofacies and environmental analysis of clastic depositional systems]] | ||
| − | |||
* [[Flow units for reservoir characterization]] | * [[Flow units for reservoir characterization]] | ||
* [[Effective pay determination]] | * [[Effective pay determination]] | ||
| − | * [[ | + | * [[Cross section]] |
| − | |||
* [[Evaluating structurally complex reservoirs]] | * [[Evaluating structurally complex reservoirs]] | ||
* [[Conversion of well log data to subsurface stratigraphic and structural information]] | * [[Conversion of well log data to subsurface stratigraphic and structural information]] | ||
* [[Evaluating tight gas reservoirs]] | * [[Evaluating tight gas reservoirs]] | ||
| − | |||
* [[Reservoir quality]] | * [[Reservoir quality]] | ||
| − | * [[Carbonate reservoir models: | + | * [[Carbonate reservoir models: facies, diagenesis, and flow characterization]] |
* [[Fluid contacts]] | * [[Fluid contacts]] | ||
* [[Geological heterogeneities]] | * [[Geological heterogeneities]] | ||
| Line 154: | Line 161: | ||
* [[Evaluating stratigraphically complex fields]] | * [[Evaluating stratigraphically complex fields]] | ||
* [[Evaluating diagenetically complex reservoirs]] | * [[Evaluating diagenetically complex reservoirs]] | ||
| − | |||
==References== | ==References== | ||
| Line 165: | Line 171: | ||
[[Category:Geological methods]] | [[Category:Geological methods]] | ||
| + | [[Category:Methods in Exploration 10]] | ||
Latest revision as of 13:56, 24 January 2022
| Development Geology Reference Manual | |
| |
| Series | Methods in Exploration |
|---|---|
| Part | Geological methods |
| Chapter | Subsurface maps |
| Author | K. W. Weissenburger |
| Link | Web page |
| Store | AAPG Store |
Reservoir properties are mapped to promote optimal field development. Subsurface maps dictate well placement and enable engineers to calculate reserves and monitor trends in reservoir performance. Geologists play a key role in subsurface mapping by using interpretations of depositional environments and diagenetic events to project reservoir data away from relatively few well control points. In this sense, subsurface mapping is in great contrast to geological mapping of the earth's surface. Whether using traditional concepts[1] or “high technology” computer contouring hardware/software systems,[2] mapping interwell areas places a premium on interpretation rather than straightforward plotting of precise data. “Mapping” is here limited to projections in plan view.
Mapping surfaces[edit]
A number of surfaces are typically mapped during reservoir development to show closure and other limits to reservoir production. Maps of top of pay and bottom of pay can also be “subtracted” to determine pay thickness.
Structure[edit]
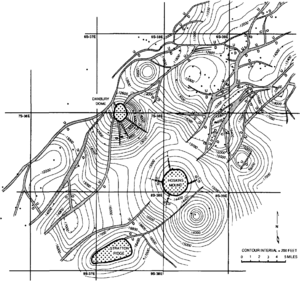
Structure maps show lines of equal elevation or depth for a selected marker horizon (Figure 1) (see Evaluating structurally complex reservoirs). Mean sea level is a useful reference datum. Commonly contoured horizons are top of zone or top of net pay. Control points are provided by surveyed wells and can be supplemented by seismic interpretations, especially offshore. In highly developed fields, typically onshore, sufficient well control might exist to allow geostatistical interpolation between control points.
Fault planes[edit]
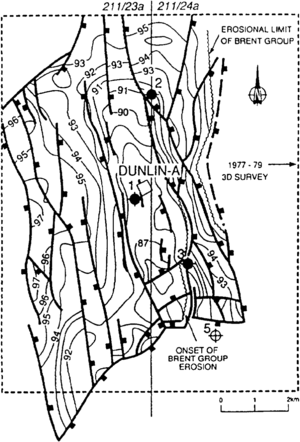
Faults are special surfaces whose traces will show on structure contour maps (Figures 1 and 2). Faults form bounding surfaces for some reservoirs, and sufficient well control might exist to contour map the fault surface itself. Projections of subsurface data into the plane of the fault are also useful “maps” for reservoir development, but are more appropriately described as cross sections. (For details of construction of fault plane maps, see Conversion of well log data to subsurface stratigraphic and structural information.)
Unconformities and subcrops[edit]
Surfaces of unconformity can be especially useful marker horizons for structure contour mapping (Figure 2). In many fields, unconformities are the location of sealing shales and/or source rocks above reservoir pay. Subcrop maps, traces of productive zones, barriers, or marker horizons mapped on the unconformity surface are invaluable for planning well placement and for reservoir development.
Pressure[edit]
Maps of reservoir pressure are useful throughout reservoir life (Figure 3). Pressures should be converted to a common depth datum, such as mid-reservoir, prior to contouring. (For information on obtaining pressure data, see Production testing and Pressure transient testing, Wireline formation testers, and Drill stem testing.)
Mapping thicknesses[edit]
Interpretations of depositional trends, pre- and syndepositional structural development, and reservoir storage capacity are based in large part on thickness information. An accurate meaning of thickness is critical in these and other analyses (see Conversion of well log data to subsurface stratigraphic and structural information).
Isopach[edit]
A contour map of equal values of true stratigraphic thickness is an isopach map (Figure 4). Except for vertical wells in horizontal beds, corrections for wellbore deviation and formation dip are needed to make isopach maps.
Isochore[edit]
A contour map of equal values of true vertical thickness is an isochore map.[7] Note that in common practice, isochore maps are informally referred to as “isopach” maps, a term that properly should be restricted to true stratigraphic thickness.
Isochron[edit]
An isochron map is a contour map of equal values of seismic traveltime between selected events.[7] Isochron maps are the seismic analog of isochore maps and, as such, are intended to derive thickness information from seismic data. Isochroning between events above and below a pay horizon, for example, would estimate pay thickness. Renick and Gunn[8] present a good case history of using isochron and time-structure maps to generate “isopach” and elevation-structure maps. Their isochron-isopach approach delineated reef trends for further development drilling and used well penetrations through a shallow horizon for depth control on a deeper horizon. Phipps[9] documents the pros and cons of using isochron thins and structural highs as exploration drilling criteria for dolomitized Devonian limestones.
Mapping to calculate reserves[edit]
When few production performance data are available, typically early in the life of a reservoir, reserves can be calculated by a volumetric analysis (see Reserves estimation). For an oil reservoir, the basic volumetric equation is as follows:
where
- N = original oil in place, stock tank barrels (STB)
- 7758 = conversion factor (acre-feet to barrels)
- A = area of reservoir (acres)
- H = height or thickness of pay zone (feet)
- ϕ = porosity (fraction of bulk volume)
- Sw = connate water saturation (fraction of pore volume)
- Boi = oil formation volume factor (dimensionless, reservoir bbls/ stock tank bbls)
A similar basic equation applies to gas reservoirs.
Net pay[edit]
The product A × H is the reservoir bulk volume, and the product A × H × ϕ is the reservoir pore volume. The general determination of bulk reservoir volume involves mapping reservoir area in plan view and mapping net pay in terms of true vertical thickness to provide a common presentation of dipping beds or deviated wells. An isochore map of net pay should be contoured using well control points and interpolated or extrapolated using available seismic and well test data and the geologist's interpretation of depositional and diagenetic history.
“Net” pay (see Effective pay determination) implies that some formation thickness has been excluded from consideration by either (1) occurring below an oil-water contact (or above a gas-water contact), or (2) having porosity and/or permeability values below a “cutoff” limit for productivity. Not all net pay is necessarily productive at a given well spacing. Discontinuous productive horizons between wells might be described, for example, by the concept of net pay to net connected pay ratio.[10]
Porosity[edit]
The porosity (ϕ) in a reservoir zone can be determined from log and/or core data. The data in an individual well within the net pay interval can be averaged arithmetically and posted on a map for contouring. The averages should be weighted by thickness.
Water saturation[edit]
The water saturation (Sw) within the net pay interval is typically estimated from well logs. Water saturations can also be derived from capillary pressure testing of cores to determine the relationship of water saturation versus height above the oil-water contact. Like porosity, the water saturation data in an individual well within the net pay interval can be averaged arithmetically and posted on a map for contouring (Figure 5). The averages should be weighted by porosity.
Oil saturation[edit]
In an oil-water system, the water saturation and oil saturation (So) sum to 1. Therefore, once Sw has been determined, oil saturation can be calculated and mapped as So = 1–Sw.
Mapping for reservoir management[edit]
A variety of maps are used to predict or monitor reservoir performance.
Permeability[edit]
Permeability (k) can also be mapped and contoured (see Core-log transformations and porosity-permeability relationships). As for saturation values, some care must be exercised in mapping permeability because values must be derived from indirect measurements. Typically, permeabilities are derived from wireline log porosities transformed on the basis of core permeability versus porosity cross plots. Permeabilities can be reported at ambient laboratory conditions of pressure or adjusted to reservoir conditions of confining pressure. Similarly, permeabilities can be absolute permeabilities to air (nitrogen) or liquid or effective permeabilities]] to oil in the presence of irreducible water. Permeability values in an individual well are thickness weighted and typically averaged harmonically, arithmetically, or geometrically, depending on flow geometry. Alternatively, flow capacity (kH) values derived from pressure transient testing can be divided by net pay thickness (H) to yield a liquid permeability value for a well.
Porosity thickness[edit]
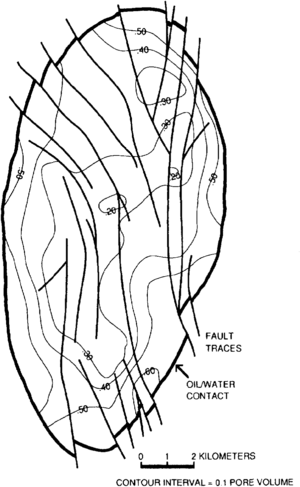
Reservoir storage capacity or porosity thickness (ϕH) is the product of porosity and net pay (Figure 6).
Productivity index[edit]
To avoid coning, sand production, pipe collapse, or other harmful effects, wells might not be produced at their maximum wide-open flow rates. Therefore, the ability of a well to produce is usually determined by a productivity index (PI).[12] The PI is a measure of the stock tank barrels (STB) of oil produced per day per psi drawdown under steady state or pseudosteady state flow conditions. Changes will show on periodic maps of PI during reservoir life indicating trends in reservoir depletion or formation damage.
Solution gas to oil ratio[edit]
Engineers forecast ultimate recoverable reserves by applying material balance equations or decline curve analysis to production history records. For example, in a depletion-type reservoir, the solution gas to oil ratio is sometimes plotted versus cumulative oil production on semilog paper.[13] If such a curve shows a good straight-line relationship, the curve can be used to predict the trend of a cumulative gas or cumulative oil plot to estimate ultimate recovery.
The solution gas to oil ratio (GOR) is the amount of dissolved gas that will evolve from the oil as the pressure is reduced to atmospheric from some higher pressure. GOR is usually expressed in units of SCF gas/STB oil. A barrel of oil and its solution gas at reservoir conditions of temperature and pressure will usually “shrink” as the fluid is produced and brought to stock tank conditions (normally reported at temperature::60°F and 14.7 psia). As GOR changes during reservoir life, GORs for individual wells can be mapped periodically to identify areas of the reservoir receiving or not receiving pressure support and serving as indicators for reservoir management action.
Water cut[edit]
Water cut is the fraction of a liquid production stream that is water, where oil cut = 1 - water cut. Like GOR, water cut will change during the life of a reservoir, and periodic mapping can serve as a performance indicator for reservoir management. A variety of performance features can be indicated by water cut maps, including water coning, directional permeability or channeling, and formation damage.
Cumulative production[edit]
Cumulative oil or gas production is a parameter useful for ultimate reserves forecasts. Cumulative production can also be mapped periodically as a performance indicator signaling areas of the reservoir that may be responding in a manner seemingly unrelated to initial potential. Figure 7 shows an example of cumulative production that was concluded to be only poorly correlated to storage capacity (Figure 6) in individual and summed zones of a carbonate reservoir.[11] In this case, porosity did not necessarily indicate effective porosity.
Other maps[edit]
A variety of other maps can come into play during the development of a specific reservoir. Maps of facies, facies architecture for more information, see Lithofacies and environmental analysis of clastic depositional systems and Carbonate reservoir models: facies, diagenesis, and flow characterization), paleoenvironment, and isolithology might be particularly important in selecting stepout well locations and planning reservoir development strategy. Other reservoir properties such as temperature can have value for specific reservoir engineering applications, particularly where potentially temperature-sensitive chemical stimulation, production, or recovery technology might be involved.
Examples of use[edit]
- Bally, A. W., Gordy, P. L., Stewart, G. A., 1966, Structure, seismic data and orogenic evolution of southern Canadian Rocky Mountains: Bulletin of Canadian Petroleum Geology, vol. 4, p. 337–381.
- Bally, A. W., Burbi, L., Cooper, C., Ghelardoni, R., 1986, Balanced sections and seismic reflection profiles across the central Apennines: Memorie della Societa Geologica Italiana, vol. 35, p. 257–310.
- Dixon, J. S., 1982, Regional structural synthesis, Wyoming salient of the Western over-thrust belt: AAPG Bulletin, vol. 66, p. 1560–1580.
- Dunn, J. F., Hartshorn, K. G., Hartshorn, P. W., 1995, Structural styles and hydrocarbon potential of the Sub-Andean thrust belt of southern Bolivia, in Tankard, A. J., Suarez, R. S., Welsink, H. J., eds., Petroleum Basins of South America: AAPG Memoir 62, p. 523–543.
- Dutton, S. P., Goldstein, A. G., Ruppel, S. C., 1982, Petroleum potential of the Palo Duro basin, Texas Panhandle: University of Texas at Austin Bureau of Economic Geology Report of Investigations 123, 87 p.
- Picha, F. J., 1996, Exploring for hydrocarbons under thrust belts—a challenging new frontier in the Carpathians and elsewhere: AAPG Bulletin, vol. 80, p. 1547–1564.
- Roure, F., Carnevali, J. O., Gou, Y., Subieta, T., 1994, Geometry and kinematics of the north Monagas thrust belt (Venezuela): Marine and Petroleum Geology, vol. 11, p. 347–362., 10., 1016/0264-8172(94)90054-X
See also[edit]
- Introduction to geological methods
- Lithofacies and environmental analysis of clastic depositional systems
- Flow units for reservoir characterization
- Effective pay determination
- Cross section
- Evaluating structurally complex reservoirs
- Conversion of well log data to subsurface stratigraphic and structural information
- Evaluating tight gas reservoirs
- Reservoir quality
- Carbonate reservoir models: facies, diagenesis, and flow characterization
- Fluid contacts
- Geological heterogeneities
- Evaluating fractured reservoirs
- Evaluating stratigraphically complex fields
- Evaluating diagenetically complex reservoirs
References[edit]
- ↑ Landes, K. L., 1951, Subsurface maps and sections, in Petroleum Geology: New York, John Wiley, 660 p.
- ↑ Jones, T. A., Hamilton, D. E., Johnson, C. R., 1986, Contouring geologic surfaces with the computer: New York, Van Nostrand Reinhold, 320 p.
- ↑ Bebout, D. G., Loucks, R. G., Gregory, A. R., 1978, Frio Sandstone reservoirs in the deep subsurface along the Texas Gulf coast—their potential for production of geopressured geothermal energy: The Univ. of Texas Bureau of Economic Geology Report of Investigations, n. 91, 93 p.
- ↑ Braithwaite, C. I. M., Marshall, J. D., Holland, T. C., 1989, Improving recovery from the Dunlin field, U., K. Northern North Sea, in Formation Evaluation and Reservoir Geology: 64th Annual Technical Conference of the Society of Petroleum Engineers, San Antonio, TX, Oct. 8–11, SPE 19878, 18 p.
- ↑ Jardine, D., Wilshart, J. W., 1987, Carbonate reservoir description, in Tillman, R. W., Weber, K. J., eds. Reservoir Sedimentology: SEPM Special Publication 40, p. 129–152.
- ↑ Hriskevich, M. E., Faber, J. M., Langton, J. R., 1980, Strachan and Ricinus West gas fields, Alberta, Canada, in Halbouty, M. T., ed., Giant Oil and Gas Fields of the Decade 1968–1978: AAPG Memoir 30, p. 315–327.
- ↑ 7.0 7.1 Tucker, P. M., 1988, Seismic contouring—a unique skill: Geophysics, v. 53, n. 6, p. 741–749, DOI: 10.1190/1.1442509.
- ↑ Renick, H. Jr., Gunn, R. D., 1989, Triangle Ranch Headquarters field development using shallow core holes and high-resolution seismic data: Geophysics, v. 54, n. 11, p. 1384–1396, DOI: 10.1190/1.1442602.
- ↑ Phipps, G. G., 1989, Exploring for dolomitized Slave Point carbonates in northeastern British Columbia: Geophysics, v. 54, n. 7, p. 806–814, DOI: 10.1190/1.1442709.
- ↑ Poston, S. W., 1987, Development plan for oil and gas reservoirs, in Bradley, H. B., ed., Petroleum Engineering Handbook: Richardson, TX, Society of Petroleum Engineers, p. 36-1–36-11.
- ↑ 11.0 11.1 11.2 Major, R. P., Holtz, M. H., 1989, Depositionally and Diagenetically Controlled Reservoir Heterogeneity at Jordan Field: 64th Annual Technology Conference of the Society of Petroleum Engineers, San Antonio, TX, Oct., SPE 19874, p. 633–640.
- ↑ Kimmel, J. D., Dalati, R. N., 1987, Potential tests of oil wells, in Bradley, H. B., ed., Petroleum Engineering Handbook: Richardson, TX, Society of Petroleum Engineers, p. 32-1–32-16.
- ↑ Garb, F. A., Smith, G. L., 1987, Estimation of oil and gas reserves, in Bradley, H. B., ed., Petroleum Engineering Handbook: Richardson, TX, Society of Petroleum Engineers, p. 4-1–40-38.

